Students who take Economics 101 learn the magic accounting formula of macroeconomics that:
Y = C + I + G + X - M
where:
Y = national income or gross domestic product (GDP)
C = personal consumption expenditures
I = gross private domestic investment
G = government consumption expenditures and gross investment
X = exports of goods and services
M = imports of goods and services
Whether domestically or internationally, the focus of economics in recent has been on monetary policy, i.e. interest rates and financial solvency. However, there is much to be learned by focusing on fiscal policy via the components of consumption, investment, government, export and import expenditures.
With this blog post, I focus on the oft-overlooked action and implications of what our national accounting tells us about the U.S. experience of the last 50 years. While seemingly even keel, there are warning signs ahead — especially if personal consumption for wage earners falters even as investment returns to wealthier Americans from intellectual property products (e.g. AI) continue to increase.
The big picture: calm sailing
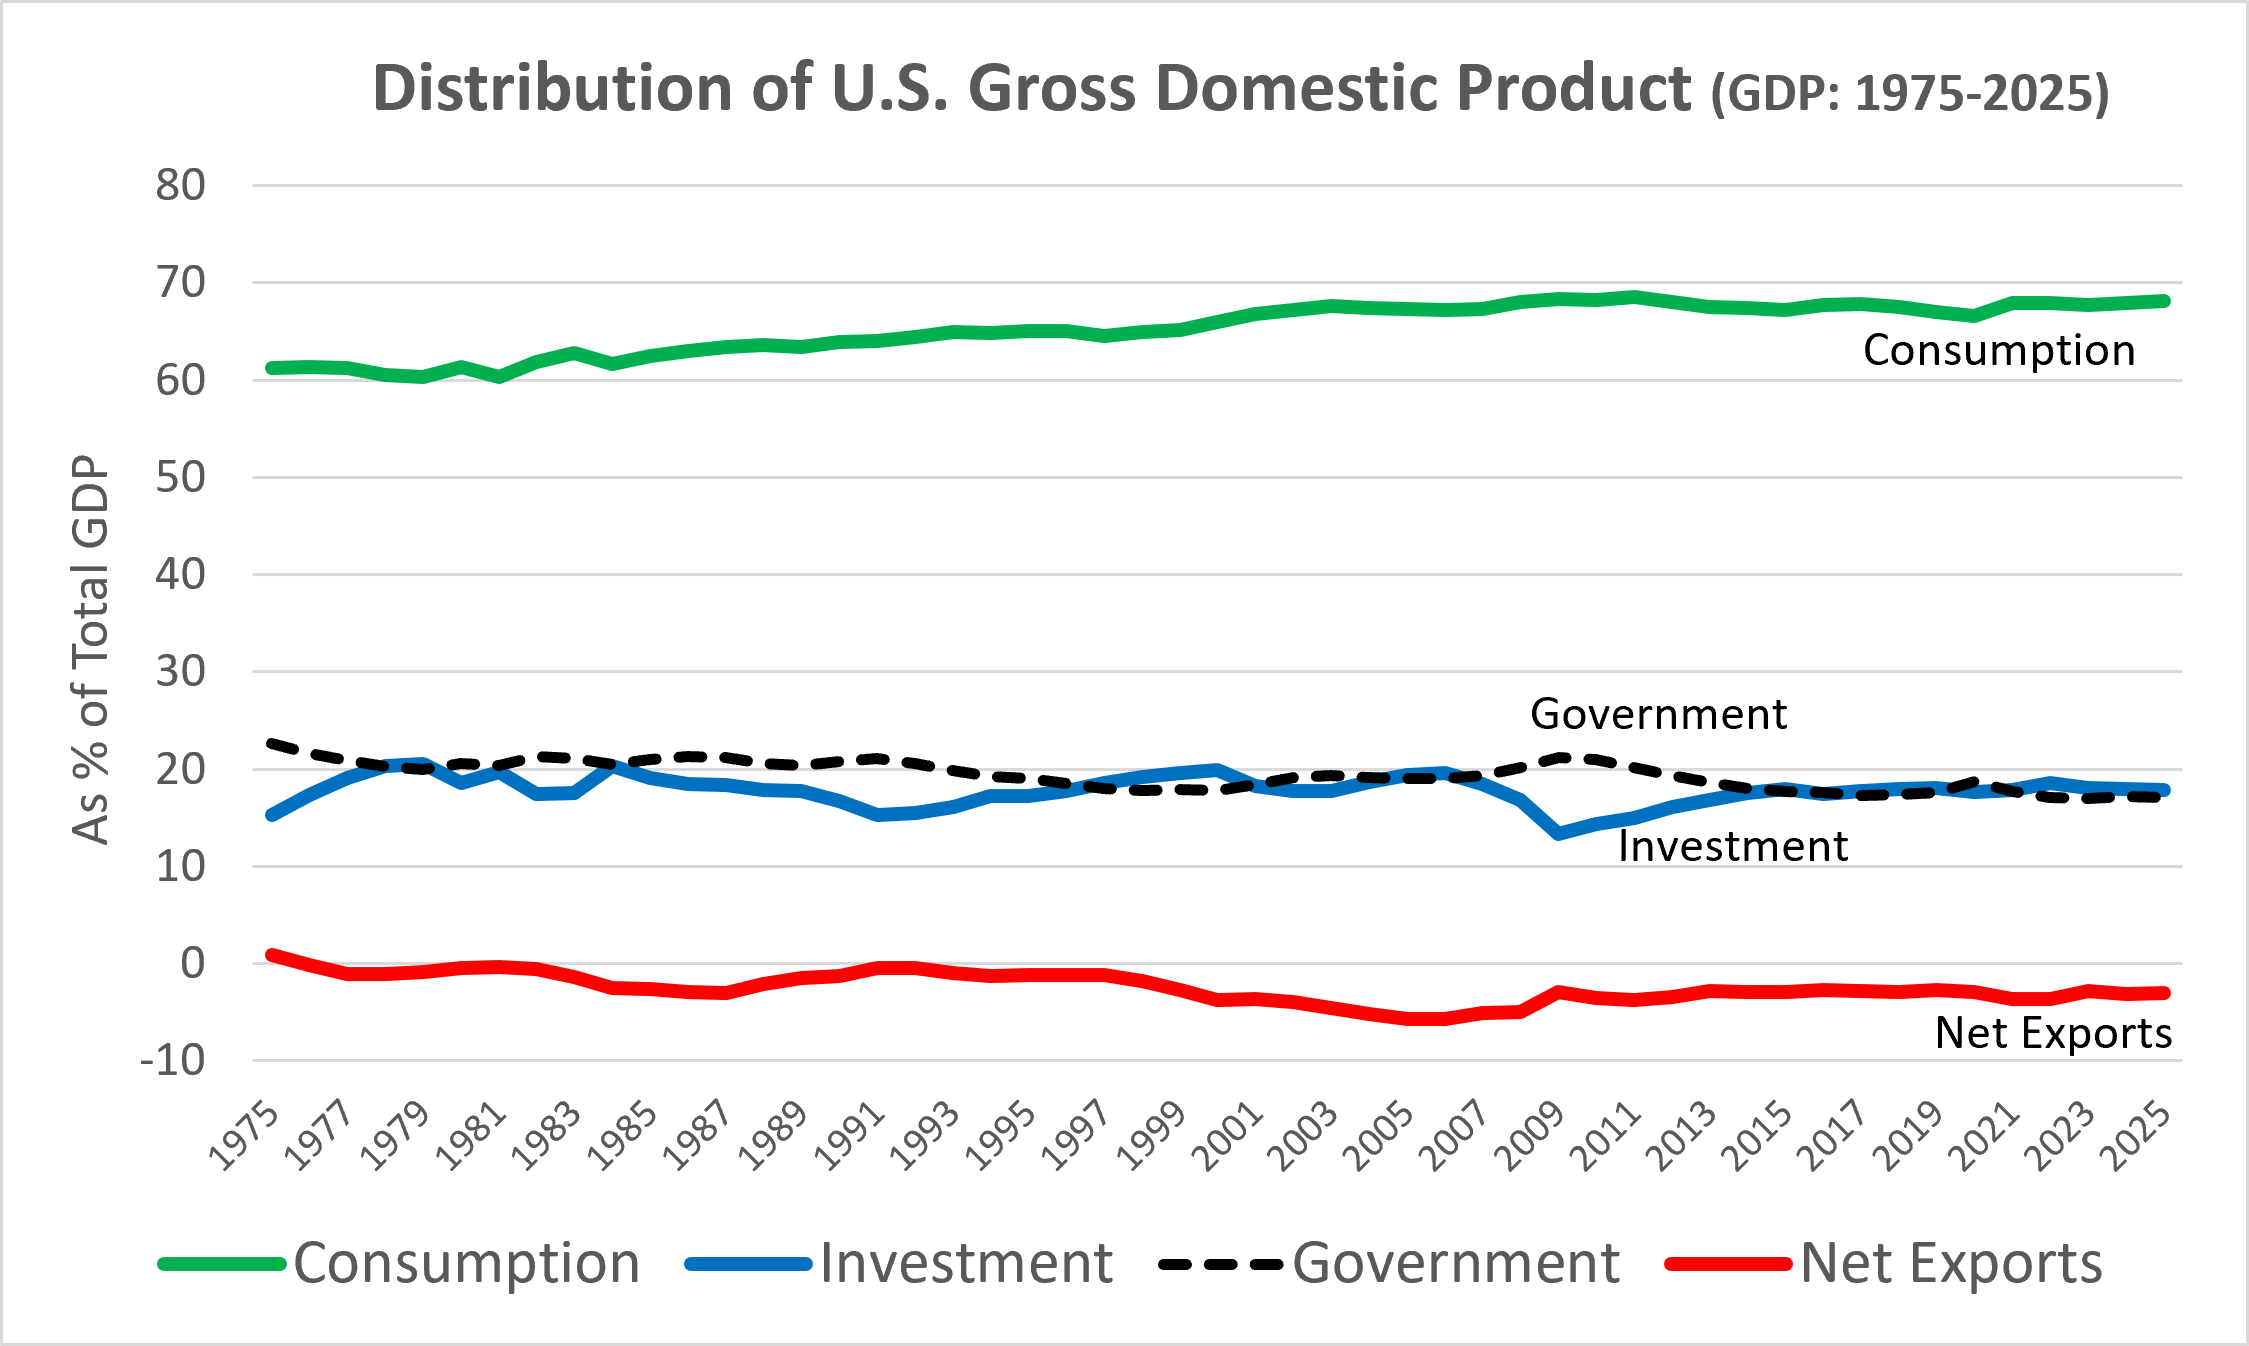
As depicted by the following graph, the last 50 years appear to evidence relative calm with relatively few pronounced or erratic shifts between the major categories of what are known as the National Income and Product Accounts (NIPA). The apparent good news is that personal consumption expenditures increased from just over 60% of GDP in the mid- to late-1970s to about 68% of GDP from 2021-25. Relatively steady gains in personal consumption spending were experienced up to the the early 2010s — with the only apparent recent dip occurring in the 2020 COVID year.
Source: Council of Economic Advisors (CEA), 2026 Economic Report of the President, Table B-4.
Gross private domestic investment has fluctuated more often from year to year — ranging from a peak of 20-21% in the later 1970s to a low of 13% of GDP in 2009 (a recession year).
A wavy pattern of government expenditures is also noted with government accounting for 20% or better of GDP in the mid 1970s, peaking again in 2009 due to stimulus spending to offset the 2007-09 recession, subsequently declining to about 17% of GDP from 2022-25. Changes in government spending appear to at least partially offset much of the variation in year-to-year private investment. When considered together, private investment and government expenditures range from a combined peak of about 41% of GDP in 1984 to less than 35% in the recession year of 2009 — where it has remained in more recent years from 2010 to present.
Finally, we consider net exports, defined as exports minus imports. Historically the nation has operated at a net export deficit generally ranging up to near 6% of GDP in 2005. Over a 50 year time horizon, exports exceeded imports only in 1975 (the first year considered with this review).
Overall, the case is often been made that a trade deficit can be beneficial, resulting in more foreign investment into the U.S. This is noted as occurring recently with foreign capital flowing into the U.S. to support AI related investment. As a side note, the one year with a substantial trade deficit improvement to just under 3% of GDP occurred in the recession year of 2009 as import demand temporarily experienced considerable retrenchment.
Despite overall calm waters (with exceptions as noted), much greater variability has occurred when we look beneath the surface to consider the various subcomponents of consumption, investment, government and exports/imports.
Personal Consumption Expenditures
Household including non-profit expenditures can be separated between durable and non-durable goods versus various services including housing, health care, financial services, transportation, education, recreation, hospitality and utility services. The big news has been the dramatic shift over the last 50 years in the composition of personal household consumption away from purchases of goods to services.
Fifty years ago, personal expenditures for goods accounted for 29% of GDP, with services representing another 32%. By 2025, personal expenditures for goods had dropped to 21% of GDP while consumer expenditures for personal services increased markedly to 47% of GDP.
Gross Private domestic investment
With respect to private domestic investment, more detail is noted with considerable variability but less identifiable overall time trends.
Residential investment peaked in the first decade of the new millenium in a range of 6-7% of GDP, then sank to just 2.5% in 2010. Even with recession recovery, residential investment has yet to fully come back, but has been stuck in a range averaging about +/- 4% of GDP since 2016.
Non-residential investment components of GDP are distinguished between structures, equipment and intellectual property products:
Investment in nonresidential structures peaked at 5%+ of GDP in the early 1980s, dropping over time to the 3% range in the 2020s to date.
Investment in equipment has also declined over time, dropping from a high of 7-8% of GDP in the late 70s and early 80s to less than 5% in 2009, then recovering somewhat before declining again into the 5% range so far for the 2020s.
The most significant investment change has been with intellectual property (IP) products. This is a category that includes investments in software, research and development — also entertainment, literary and artistic originals. Collectively known as knowledge-based capital, this conglomeration of varied IP products has steadily increased from less than 2% of GDP in the late 1970s to a range of 5-6% of GDP from 2020-25.
Government Expenditures
Primary NIPA subcategories of government consumption expenditure and gross investment include federal expenditure for national defense and non-defense together with state and local expenditures:.
Defense has declined steadily from a peak of 7.7% of GDP in the mid 1980s to 3.7% as of 2025.
Non-defense spending also has declined as a share of GDP, though not as dramatically as for defense. From a high point at 3.3% of GDP in 1975, nondefense spending retrenched to a low 2.3% share of GDP in 2000, then gaining to a 3.0% share in 2020, again declining to a 2.7% GDP share as of 2025.
State and local government consumption expenditures have been relatively stable, representing a 10-13% share of total GDP over the last 50 years. The state/local share peaked in 2009 (the year of the Great Recession) but have since declined back to less than 11% from 2022-25.
Exports & Imports
Exports as well as imports of goods and services all have increased as a share of U.S, economic activity over the last 50 years — though importing has increased more rapidly:
Exports of goods have risen from a low of just over 5% of GDP in the mid 1980s to a peak of over 9% in the 2011-14 time period, then dropping back to less than 7% as of 2025. Export of services have increased from a lower base, starting at 1.5% in the mid-1970s and increasing to a peak of about 4.3% in the 2010s, then declining somewhat to less than 4% of GDP since 2020.
Imports of goods have increased from less than 6% of GDP in 1975 to a peak of 14.5% in 2008, since declining to just under 11% as of 2025. Imports of services have also increased though starting from a lower base and with still lower penetration by non-U.S. firms to date. Imports of services started at about 1.5% of GDP as of the mid 1970s, with steady increases to peak at 3% in 2011, then dropping to 2.2% in 2020 before recovering somewhat to just under 3% as of 2025.
Stressed Sectors of the u.S. Economy
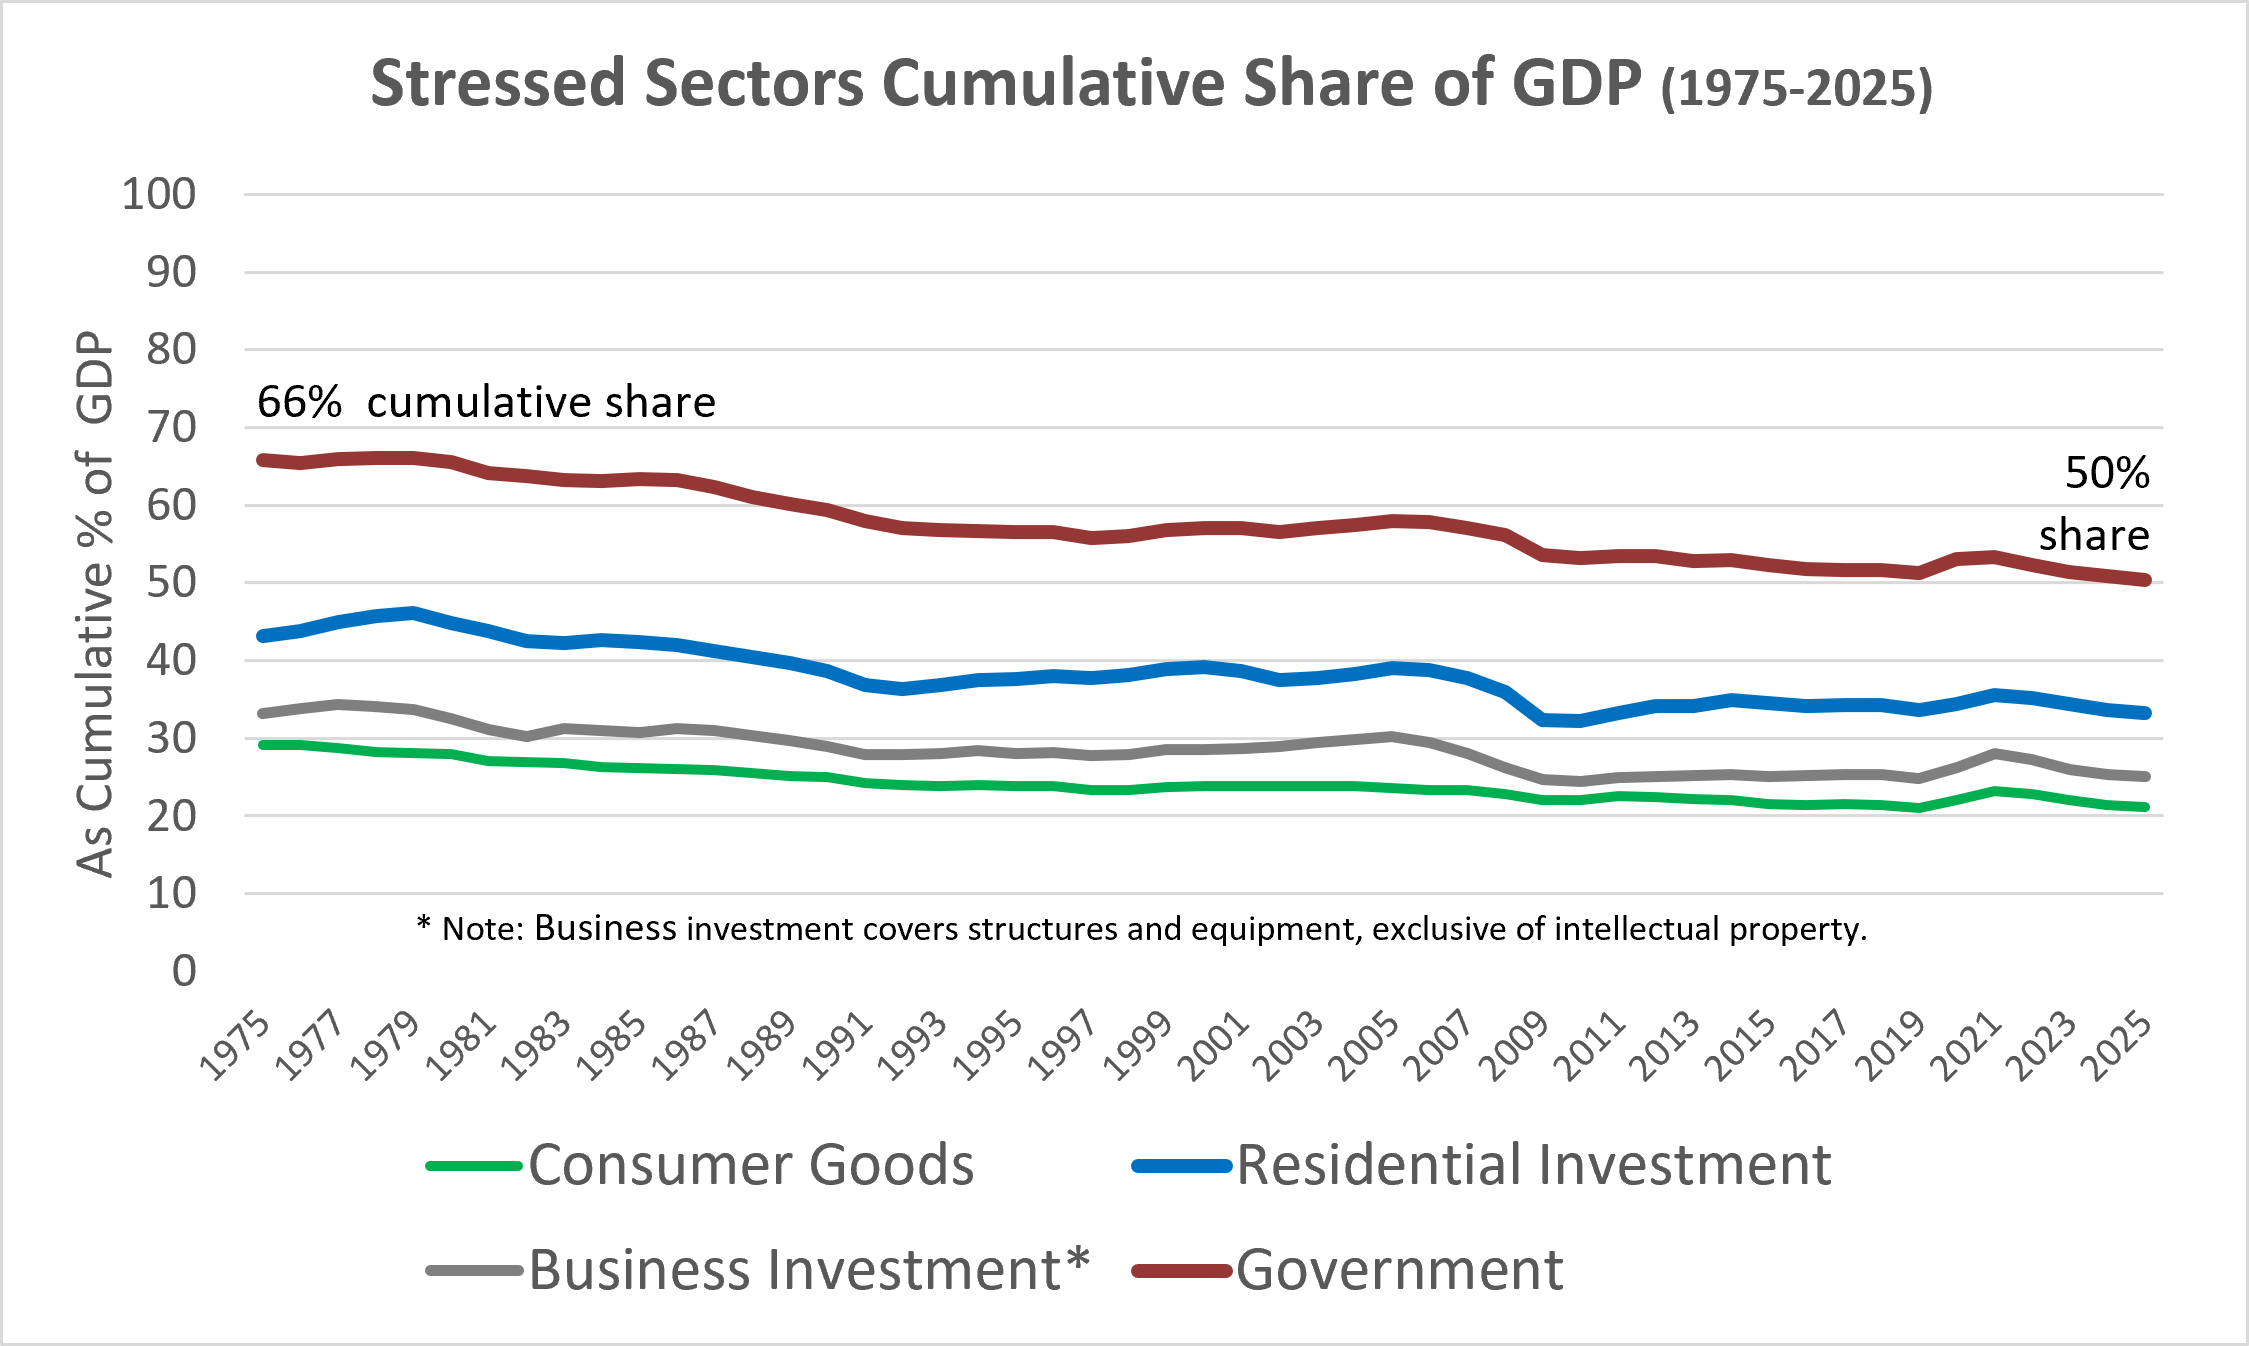
What does this portend now and for the future? Based on this sector-by-sector analysis, it is worth focusing in on those sectors that account for declining shares of American GDP. These so-called stressed sectors include consumer goods, residential and business investment, and government. Taken together, stressed sectors which have seen their combined (or cumulative) share of GDP decline from 66% of GDP in the mid-1970s to 50% as of 2025 — as illustrated by the following graph
Source: 2026 CEA.
Specifically noted is that:
Consumer goods (excluding services) have gone from 29% of GDP in 1975 to 21% as of 2025.
Residential investment peaked at 6-7% of GDP in the early 2000s, more recently settling in in the range of 4-5%..
Non-residential business investment in structures and equipment has gone from a peak of about 12% of GDP in the early 1980s to a low point in 2009-10, recovering only marginally to just over 8% as of 2025.
And combined governmental consumption and gross investment has declined from a peak 22-23% of GDP in the mid 1970s to about 17% across each of the last four years — with declines noted across all governmental sectors including federal defense and non-defense as well as for state and local expenditure.
OBSERVATIONS & Implications
The principal observation drawn from this review of perhaps mind-numbing data is that the apparent overall stability associated with the distribution of American GDP may not be so calm when diving beneath the surface. Rip tides await:
The #1 warning sign is that the combination of personal services expenditure and intellectual property has gone from 34% of GDP in 1975 to 53% as of 2025 — with the rate of increase being most rapid for intellectual property products. Wage and salary households have shared in the increase in personal services consumption, less so from intellectual property — the financial rewards of which go disproportionately to the wealthy.
If technology (notably AI) investment continues its rapid escalation, there is greater risk of squeezing other business investment and possibly personal consumption expectations for the average American, except as may be supported by investment funded from other sources such as capital inflows to offset U.S. trade deficits.
The squeeze further tightens if this comes as pressure concurrently builds for turnaround to increase government’s share of GDP — whether driven by national defense priorities or entitlement programs as for an aging population or both at the same time.
Public dissatisfaction may be further exacerbated by widening income disparities with perceptions that those most benefitting from technological change are not paying their fair share.
In the absence of structural reform, it can be expected that wage and salary workers combined with expanding ranks of seniors will become increasingly frustrated to the potential point of seeking more radical change — as exemplified by the current national political climate.
Bottom line, the best options for addressing and mitigating unrest will require public and private actions to improve efficiency and productivity for household service consumption as well as governmental services — both for defense and non-defense entitlements. This may be where AI most proves its societal worth — not just for mega cap businesses and their investors but for all Americans.