Two years ago on July 25, 2018, I posted a blog titled California’s Central Valley: Guideposts to Economic & Community Vitality. As this post has received on-going reader attention, it seems worthwhile to provide a fresh look — or an Economic Vitality Update.
Note: For background, it may be useful to review the 2018 initial report which can be found by clicking on:
2018 CA Central Valley Review
Approach
This review picks up from where the initial 2018 analysis left off:
The previous analysis provided a statistical comparison of eight valley counties and their major cities — based primarily on 2017 population and demographic data.
This update focuses on changes from 2017 to present — covering most of the same data variables (with one change as noted below).
Communities
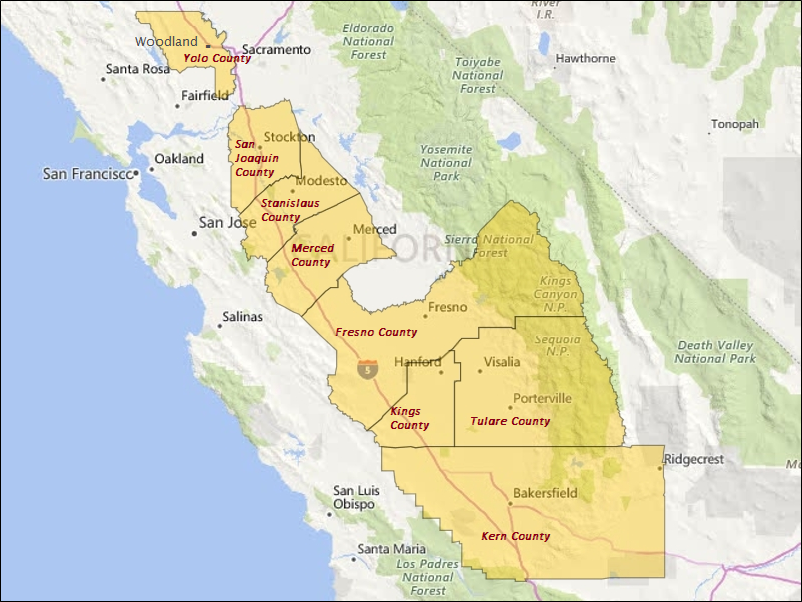
As shown by the map below, eight cities and their respective counties in the San Joaquin or Central Valley were selected for analysis — both then and now.

Starting northwest and heading southeast, populations of each primary city and associated county as of 2020 have been estimated as follows:
Woodland — Yolo County
(60,000 — 224,000)Stockton — San Joaquin County
(315,000 — 766,000)Modesto — Stanislaus County
(212,000 — 557,000)Merced — Merced County
(85,000 — 280,000)Fresno — Fresno County
(533,000 — 1,009,000)Hanford — Kings County
(57,000 — 152,000)Visalia — Tulare County
(135,000 — 473,000)Bakersfield — Kern County
(388,000 — 908,000)
Note: Except as noted otherwise, population and key area demographic estimates are those of the nationally recognized proprietary data firms Environics/Claritas. Estimates are as of early 2020, predating the current COVID-19 pandemic and conduct of the 2020 U.S. Census.
Central Valley cities currently range in population from 57,000 (Hanford) to 533,000 (Fresno). County-wide populations go from 152,000 (Kings County) to just over 1 million (Fresno County). Population growth has been relatively modest from 2017-20 for most cities and counties (averaging about 0.7% per year). Continued growth of Central Valley communities contrasts with near stagnant population growth experienced statewide over the last three years. In percentage terms, the most rapidly growing city has been Hanford with San Joaquin and Yolo as the most rapidly growing counties since 2017.
The Hispanic/Latino share of the population has increased since 2017 for all eight cities. Latino incomes appear to have increased relative to all incomes for all cities considered but Visalia and Woodland.
Rates of home-ownership have increased across all eight cities — as have housing prices. In dollar terms, price appreciation has been most substantial in Stockton, Modesto and Woodland — each increasing by an estimated $100,000-$120,000 in just three years.
A new metric -- county-wide employment — has been added with this updated analysis. Employment state-wide increased by 3.6% from 2017-2019 — a rate of growth exceeded by five of the Central Valley counties.
Community & Economic Vitality Metrics
With the 2018 analysis, 11 factors were applied as indicators of community and economic vitality. Ten of the 11 are retained with this update together with one change — described as follows:
City population growth rate — with higher growth rates assumed to be a key indicator of local vitality.
County population growth rate — reflecting regional as well as local community growth
% change in median age of population — with a trend to younger cohorts offering added workforce opportunities for large and small employers.
% change in share of adults with bachelor’s degree or better — with more education offering improved opportunities for higher wage jobs and career advancement.
% change in share of Latino adults with bachelor’s degree or better — similarly for better workforce opportunity.
% change in median household income — a key indicator of household purchasing power.
% change in Hispanic/Latino incomes relative to all incomes — with above average improvements more highly rated.
% change in share of families below poverty level — with reduced poverty providing evidence of improved and more equitable distribution of incomes.
% change in share of homes that are owner occupied — with home ownership viewed as important for community participation and building resident equity.
% change in County-wide average annual employment from 2017-19 — noted as a new metric added with this update based on QCEW covered employment data.
Notes: The indicator that was present with the 2018 analysis but removed with this update is median home value. This is more of a mixed bag than previously as rapid home value appreciation may be a positive for those who are already owners but a potentially negative vitality indicator for those not yet homeowners and for whom affordability has again become a significant issue.
Also noted is that while the prior analysis compared communities — in many cases — on comparative values as of a 2017 point in time, this update focuses on relative changes for these metrics since 2017. This means that a community with a below average score on a particular metric could score above average on the current set of metrics if the pace of its recent change outpaces the rate of improvement for historically above average communities.
Scoring Community Performance
In the 2018 initial analysis, communities were classified as high performing if they met 8 or more of the 11 metrics considered. Other communities were noted as mid-tier and lower performing.
With this update, only one community — Hanford in Kings County — achieves a top-tier ranking by meeting 9 of the 11 performance metrics. This is notable because in 2018 Hanford scored in the middle of the pack meeting just 5 of 11 performance metrics.
The only two change factors for which Hanford currently appears to score below average are in county-wide population growth since 2017 and change in Hispanic/Latino incomes as a % of all household median income.
Characteristics of the other seven cities — in order of post-2017 change ranking — are briefly summarized as follows:
Fresno scores above average on six of 11 factors — improved higher education levels (with bachelors degrees or better for all adults and Latinos), overall median household income, reduction in poverty rates, increase in the white collar share of employment, and % change in county-wide employment.
Bakersfield scores above average on 5 factors — city-wide population growth, increasing proportion of all residents with higher education, increased Latino incomes relative to all incomes, increasing home-ownership, and % change in county-wide employment. Note that recent performance, while still in the upper tier of the 8 valley cities is below 2018 comparative performance when Bakersfield ranked #1, meeting 10 of 11 performance benchmarks.
Merced also is rated above average on 5 factors — albeit a somewhat different mix including above average city and county-wide population growth, increased higher education levels for Latino adults, increasing share of Latino relative to all household incomes, and increasing home-ownership.
Woodland is the third city scoring above average on 5 factors — county-wide population growth, reduced median age of residents, increased levels of higher education for Hispanic adults, increasing overall median household income, and % change in county-wide employment.
Modesto rates above average on 4 factors — increasing overall and Latino household incomes, reduced share of poverty-level families, and growing proportion of white collar jobs.
Visalia also scores above average on 4 factors — increasing higher education for Latino and all adults, increased proportion of white collar jobs, and increasing home ownership rates.
Stockton scores above average on just three change factors — county-wide population growth, reduced proportion of households in poverty, and county-wide employment growth. Note that with the 2018 rankings, Stockton also scored lowest of the eight cities with only 2 factors indicated as above average.
Concluding Observations
Based on this data alone, it is difficult to draw definitive conclusions about factors underlying changed community performance for community and economic vitality. However, three preliminary observations are offered as a basis for further consideration:
The smallest and the largest Central Valley communities seem to be having an easier time with continued improvement than those in the middle. The city/county with the least population (Hanford/Kings) ranks well ahead of the other seven in terms of improved performance across more of the range of metrics considered. The counties with above average job growth are lesser populated Kings, together with the three most populated counties of Fresno, Kern and San Joaquin. Fresno and Kern/Bakersfield do better than most across the full range of metrics — though San Joaquin/Stockton lags behind with most of the other vitality indicators considered.
There appears to be no guarantee that top performers remain ahead of the pack where continuous improvement is concerned. The #1 performer of 2018 comes in tied for 3rd-5th in the realm of continued improvement with this update. Another high performer of 2018 — Woodland — also comes as part of the 3rd-5th tie. And Visalia slips to the bottom three in terms of scoring for continued improvement in the last three years. Conversely, Fresno improves its previous mediocre rank to come in 2nd highest for recent improvement across the 11 change metrics considered.
Improved outcomes for all residents do not necessarily go hand-in-hand with improvements for Latino/Hispanic residents. This is most apparent on the metrics where total population comparisons are made with those of the relevant Latino population — attainment of bachelor’s degree or better and improvement in median household income. Of six cities that experienced an above average increase in higher educational attainment for all adults or for Latinos, in only three were above average improvements made for both Latino and all adults. With respect to gains in median household income, the disparity is even greater. Six cities experience above average increases in median income for all households or all Latino households. In only one city — Modesto — were above average gains experienced both for Latino and all households. In three cities, above average gains were made for all households but not for Latino households. In two cities, above average gains were experienced for Latino households but not all households.
Perhaps the most important observation is that it is challenging for any community to be “firing on all cylinders” at all times. Market forces tend to push toward re-balancing as yesterday’s winners lag behind the up- and coming of today. And even within a community, it should not be expected that strong performance with one metric will automatically assure similar high achievement across other metrics.
While comparative performance can be useful to spur laggards to action, perhaps of greater importance is the need to strive for continuous improvement for those metrics deemed most significant for each community — raising all boats to the greatest extent possible.
Final Notes: While the data available and utilized for this update precedes the realization of America’s coronavirus pandemic, it is noted that agricultural workers and the Latino population of California’s Central Valley now are being affected by COVID-19 at among the highest rates in California. In addition to direct health effects, the pandemic may also disproportionately affect the economic vitality of valley communities short- and/or longer-term. Consequently, documentation of these impacts and potential mitigation is of greater significance both now and going forward — especially as relevant local experience-based data becomes more available.
Also noted is that with anticipated completion of the U.S. Census, some of the demographic metrics may change from the Environics/Claritas data provided. Due to challenges on multiple fronts, it may be more important than with previous censuses to assess the reliability of completed Census datasets as they become available over the next couple of years. Of added importance will be up-to-date employment data to better assess the pace and extent of local/regional economic recovery and resilience.