Early Returns Are In ...
With the Great Recession officially ended in 2009, U. S. employment actually bottomed out in 2010 at less than 198 million jobs. by the 3rd quarter of 2015, employment covered by unemployment insurance had worked its way up to nearly 140 million jobs, a 9% gain of 11-12 million jobs nationwide.
In this first blog, I look at the mix of the changing U.S. job base. In future blogs, the focus will shift to economic and development trends in varied regions of the U.S. - starting with my backyard of the Pacific Northwest.
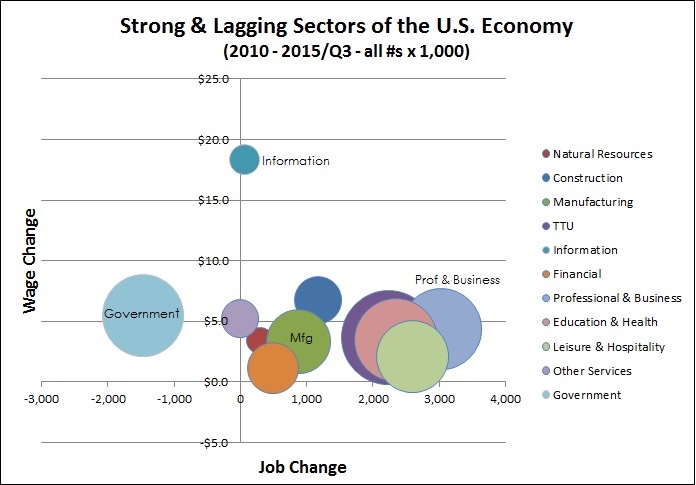
As depicted by the graph below, this review of national experience since 2010 focuses on:
Current job base (shown by circles)
Change in # of jobs in the last 4-5 years (horizontal axis)
Change in annual wages by job sector (vertical axis)
This overview offers some mixed and perhaps surprising messages about the rapidly changing mix of the U.S. job base.
A few observations to help put all this in perspective:
Of nearly 140 million jobs in the U.S. the single largest sector is trade, transportation and utilities (TTU) - with 27 million jobs in a rather unwieldy sector including both retail and wholesale trade as well as transportation and utilities.
Next largest are education/health services, government, and professional/business services - at about 20 million jobs each.
In the last 4-5 years professional/business services have added the most jobs - up by about 3 million (for 26% of all net job growth nationally). Other major job producers are in TTU, education/health, and leisure/hospitality - each up by 2+ million.
Government employment is actually down by nearly 1.5 million, an apparent reflection of the end of stimulus combined with state/local layoffs in (delayed) response to recession related revenue declines.
With 12 million employees, domestic manufacturing is ever more streamlined. However, in a major reversal from decades of declining employment, U.S. manufacturers added nearly 900,000 jobs in the last 4-5 years.
Average firm size is generally on the increase - except in the sectors of information, education/health and government.
The star performer in terms of wage gains is information. The total jobs count is stagnant, but a dramatic shift is taking place as the sector transitions from printing and publishing to software and internet related applications. Average wage increased by over $18,000 per year - a reflection of this shift and the strong market demand for techies.
For other sectors, wage gains since 2010 have been more modest, up by between $1,000 (in financial services) to $6,800 per year (with construction rebound) as of Q3 2015. Across all sectors combined, wages have increased by less than 2% per year.
Looking ahead, items of importance to monitor include translation of job growth to also support stronger wage growth, opportunities for high demand sectors like information to start adding net new jobs as the transition from older sub-sectors like printing runs its course, sustainability of domestic manufacturing competitiveness (amid a stronger dollar), and potential government job rebound.
