In our last blog (of March 16), the focus was on changes in U.S. employment from when job counts during the Great Recession bottomed out in 2010 to the most recent Q3 2015 data on nationwide jobs and payrolls. With this second phase analysis, the scope narrows to the Pacific Northwest (PNW) states of Washington, Oregon and Idaho.
Despite severe job losses thru the heart of the recession, the PNW has rebounded smartly in the last 4-5 years since 2010. Employment in the 3-state region has increased by 13%, well above the 9% job increase nationwide. Currently the PNW now has a based of 5.7 million jobs (covered by unemployment insurance), representing about 4% of the 140 million workers across the U.S.
As with the U.S. analysis, these changes are depicted by the graph below which shows:
Current PNW job base (measured in relative terms by the size of the circles in the graph)
Change in # of jobs in the last 4-5 years (horizontal axis)
Change in annual wages by job sector (vertical axis)
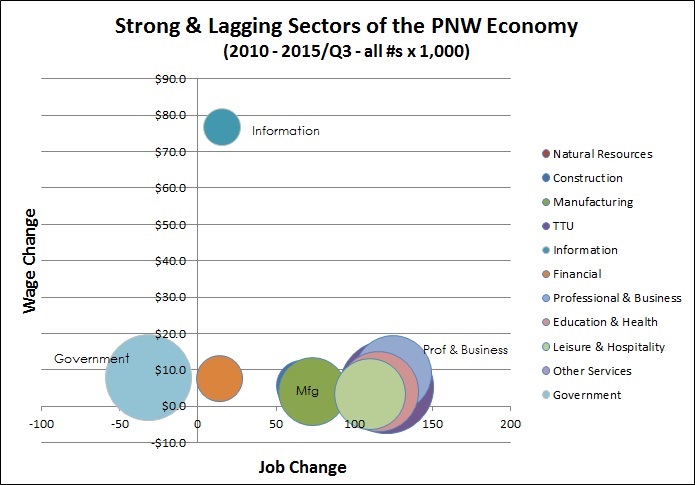
In several respects, the PNW graph closely mirrors national experience (see graph with earlier blog below). The same sectors that dominate the national landscape also tend to represent the greatest concentrations of employment in the Pacific Northwest. The #1 sector for net job growth nationally and regionally post-recession has been with professional and business services. While a large sector, government represents the only sector of the economy for which net job loss is indicated post-2010. And overall, wages have increased at about the same pace averaging 1.7% per year across both the U.S. and PNW.
However, clear differences are of note as well:
While manufacturing employment has picked up across the U.S., the rate of PNW job growth has been twice that of the nation. Similar outsized performance is noted for the smaller job sectors of natural resources (including agriculture) and information.
Average size of PNW firms is increasing more than three times as fast as for the U.S. (not directly shown by the graph).
And, most astoundingly, the information sector (ranging from publishing to software) is associated with a nearly $77,000 per year average increase in compensation per year - well above the still remarkable $18,000 per year gain experienced over the last 4-5 years nationwide. State and federal employment data indicates that PNW payroll per information now averages almost $172,000 per year - largely driven by outsize compensation for high performers, particularly in the Seattle metro area.
Looking ahead, obvious questions relate to sustainability of information sector payrolls as well as to continued resurgence of manufacturing and national resources employment (benefiting rural and smaller metro areas of the PNW recently). Other sectors of importance to continued balanced regional job growth will be construction, professional and business services, education and health, leisure and hospitality, and trade transportation and utilities (TTU) - together with stabilizing government sector employment.
