U.S. STOCKS - POST INVASION

In April of 2022, this blog reviewed changes in stock market performance in the year prior and also the just over six weeks period subsequent to the Russian invasion of Ukraine launched February 24, 2022. This blog updates the review to cover the post invasion experience 1-year later in two parts:

  • For the full year of February 24, 2022 to February 24, 2023; and

  • For the most recent portion extending from the 2023 New Year to present or year-to-date (YTD).

As with last year’s review, the analysis is organized to cover the 11 key sectors of the U.S. economy as included with the S&P 500 index. Not surprisingly, stock performance by business sector since this New Year’s Day varies considerably from that of the full year since the Russian invasion — with implications for the rest of 2023 if not beyond.

The Full Year Look

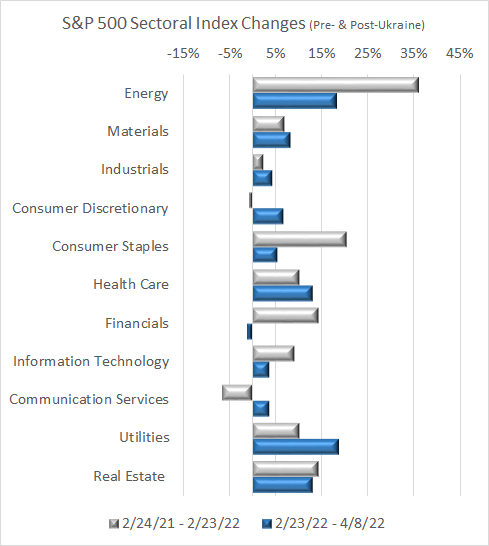
The graph below depicts performance for the full year since the invasion (shown by the gray bars) vis-a-vis the most recent experience since the start of 2023 (blue bars). For the full year:

  • The S&P 500 index declined by 6.0%. This was greater than the 1.0% valuation loss of the Dow (DJIA) and the 2.8% loss of the Russell 2000 index but much less of a loss than the 12.6% valuation decline of the Nasdaq.

  • From a sector-by-sector perspective, the energy sector was the big winner — with a 26% year-over-year valuation gain (much of which occurred early on around initiation of the Ukrainian conflict).

  • At #2, industrials came in well behind #1 with a valuation gain of just under 5%. The only other sectors showing (modest) valuation gains were utilities and health care.

  • The other seven S&P 500 sectors all showed losses for the year led by communication services (with a 22-23% valuation loss). The long vaunted information technology sector experienced an 8% sell off of market value.

Focus on 2023 YTD

Performance of the market since the 2023 New Year (shown by blue bars) is considerably different from that of the full year since the invasion:

  • For the S&P 500, the market has reversed the full year loss to indicate a gain of 3.4% since opening day of January 3 — although much of this gain happened in January followed by much weaker performance in February.

  • The consumer discretionary sector (i.e., higher end purchases) has been the strongest performer, up by just over 11% YTD. This is a major reversal of its 10th place full year performance compared to what has occurred in less than the last 60 days.

  • Six other sectors have experience positive YTD valuation performance — ranked in order as a resurgent information technology sector, then communication services, materials, financials, real estate, and industrials.

  • Four sectors have experienced valuation losses for YTD 2023 — led by utilities at a negative 6%. As the star valuation gainer of the early Ukranian experience, energy has gone from # 1 performer for the full year to #9 when considered for the more recent time frame since the 2023 New Year (with valuation loss of 4%). The other two sectors showing valuation losses YTD are consumer staples and health care.

Looking Ahead

The remainder of 2023 offers the prospect of continued volatility for the stock market — across the spectrum of institutional, professional and individual investors. With experience of the Great Recession followed a decade later by the COVID pandemic, both now largely in the rear view mirror, attention turns to the continuing and most recent dynamics of market and economic transformation — both domestically and globally.

The forces of this transformation include transitory and structural inflation, supply chain reshoring, labor force and housing shortages, a rapidly aging population, declining productivity and need for automation, uncertain trajectory of energy transition, financing lock-down, and both domestic and global balkanization. These forces pull in multiple and often changing directions. All have been catalyzed by COVID and now Ukraine.

Fasten the seat belts — for a wild and woolly 2023 — hopefully leading to a better vision of new, new normal looking beyond this year to the remainder of the decade.

For comments on this blog post or to request inclusion on my email notification list for future E. D. Hovee blog posts, please email me, addressed to: ehovee@edhovee.com

Also note: A listing of and links to past blog posts is available at:
Blog Post Listing.

U.S. Stocks Pre- & Post-Ukraine

Ukraine’s humanitarian crisis is re-ordering the contours of the U.S. and global economy. A leading indicator of this change is provided by the shifting sands of the the stock market. What remains to be seen is whether and how the war and these market shifts persist in the months ahead.

Comparative Stock Indices

We begin by reviewing the changes in four major stock indices in the year prior and the just over six weeks period subsequent to the Russian invasion of of February 24, 2022. What has been surprising is the resilience of the market even with the shock of the Russian invasion coupled with on-going concerns with surging inflation and residual COVID uncertainty. As illustrated by the following graph:

  • The Dow index comprised of 30 of the largest U.S. companies actually has increased by more post-invasion than over the full year prior to the invasion. The Dow peaked on January 4 of this year, dropping by 10% over the next month and one-half to February 23 (the day before the invasion of the Ukraine). In effect, the nearly 5% gain experienced since then covers only about half of the pre-invasion loss with growing market uncertainty leading up to February 24.

  • Of the four indices reviewed, the S&P 500 representing 500 leading publicly traded companies experienced the strongest gains leading up to the invasion and the most substantial recovery since.

  • The Nasdaq index, a composite of more than 3,000 stocks including REITs, experienced a net loss over the course of the pre-invasion year for those investors that did not pull out of the market by early 2022 — but with the 2nd strongest recovery from February 24 - April 8.

  • And the Russell 2000 which represents 2,000 of the smallest publicly traded companies is associated with the greatest valuation loss for those investors who did not exit these stocks before February 24 and the slowest recovery since.

Added Notes: In the year pre-invasion, index values peaked in later December/early January for the Dow and S&P. Peak values were experienced somewhat earlier in November for for the Nasdaq and Russell 2000 indices. Values to date in 2022 bottomed out on March 8 for the Dow and S&P, with the trough experienced a few days later on March 14 for the Nasdaq and Russell 2000. The day before the invasion (February 23) was the 2nd or 3rd lowest value of the year to date depending on the index considered.

Index Valuation Changes by Sector

This review now transitions to a more in-depth consideration of valuation changes by stock sector. As the best performing index both pre- and post-invasion, this analysis draws on the experience of the 11 primary sectors as categorized for S&P 500 stocks.

As with the major indices, changes are compared both pre- and post-invasion for each of 11 sectors — as illustrated by the graph below. Most notable is the apparent shift in which sectors are hot versus what’s not.

For these 11 overall S&P 500 sectors, it is noted that:

  • Energy represents the #1 most rapidly appreciating sector pre-invasion and #2 growing sector in the 6+ weeks since February 23. Market valuations in this sector started coming on strong in early 2021, then slackening through late summer, then further ramping up from January 2022 to present.

  • As a major consumer and distributor of energy, utilities have moved up from 6th of 11 sectors pre-invasion to become the strongest gainer since February 23. What has been a relatively sleepy sector of the economy is now more front and center — both now and likely for much or all of the duration of the Russian-Ukrainian conflict.

  • Over the pandemic prior to the current crisis, consumer staples represented the 2nd most rapidly appreciating sector of the market — now fading post-invasion to 7th position of the 11 S&P sectors. This is also a sector affected by pressure for more value shopping as consumers adjust to inflation — worsened by disruptions of key agricultural exports from the Ukraine and Russia.

  • Valuations for information technology and communication services peaked in the latter months of 2021 and have waned since — in response to factors ranging from inflation to public frustration with big tech. A question on the horizon is how these and related sectors regain their luster and public trust. Of pivotal importance is the need for increased U.S. semiconductor capacity to remedy constraints across other sectors (ranging from industrials to consumer staples and consumer discretionary spending).

  • Real estate has maintained a position of relative strength — at position #3 pre-invasion and slipping only slightly to #4 so far post-invasion. Commercial real estate remains challenging and home refinancing activity has plummeted. Industrial/distribution demand remains strong. This has also been the case with new home sales — but for how long as residential prices and interest rates rise, inevitably pricing more out of the market.

  • Even as the COVID pandemic recedes, health care has improved its relative stock standing — moving up from 5th to 3rd position as management shifts from crisis mode back to the full portfolio of other temporarily underserved health needs.

  • Materials have been the sleeper but are now moving up from 8th to 5th spot — now highlighted by short- and long-term ramifications of the Russian-Ukrainian conflict. Materials including rare earths coming in large part from unstable and hostile regions of the globe are pivotal to the long-term shift from fossil fuels to clean energy. Finding solutions will be dependent on investment in sources more stable and accessible to the domestic and global market.

  • Financial stocks appear to be downshifting from 4th to 11th position as recent and likely continuing interest rate hikes affect loan demand, bond and loan valuations, and resulting earnings growth. Deposits are also exiting financial institutions as savers look to better opportunities in the as yet unfamiliar environment of increasing interest rates.

  • Last but not least, consumer discretionary spending and associated business valuations have been improving as COVID shifts from pandemic to endemic but predicated on further return to travel and vacations now made less certain by the combined effects of global instability, auto availability and inflation plus residual concern with potential COVID resurgence.

For at least the near term, expect continued focus on a return to the basics — addressing continuing if not increased instability of key supply chain bottlenecks — affecting the full range of market sectors. What have been the less glamorous sectors of materials, energy and utilities now take on more prominence with needs for greater innovation and resulting opportunity for return on investment.

Bottom line, the Russia-Ukraine conflict together with the growing China - U.S. rift highlight the need to re-balance the dynamic between global interdependence versus national or regional self-reliance. For humanitarian and economic perspectives, the most viable solution should not be about “either or” but rather “both and…”