UNIVERSAL BASIC INCOME - IS NOW THE TIME?

In this brave new world of the 21st century, disease and robots make strange bedfellows. If there was ever a time to consider the once-radical concept of a universal basic income, this may be it.

Two forces may yet compel the realization of the previously unthinkable:

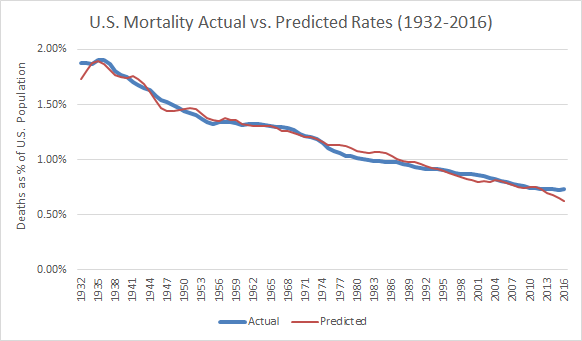
  • The accelerating effects of technology-driven automation — suggesting a world where ever fewer human workers may be required in the not-so-distant future,
    coupled with

  • The historically unprecedented and governmentally mandated concurrent shuttering of American and global economies — with human livelihoods subordinated at least temporarily to mitigating the mortality effects of a novel disease known as coronavirus

And here’s where the long- and short-term drivers of economic life on the planet become intertwined. Even with massive unemployment, the reality is that it really takes fewer and fewer people to provide the basic services — food and shelter — required for survival of the human species.

The long-term march of technology makes it possible to survive the (hopefully) short-term shock of economic dislocation that is now well underway. And independent of one’s views about the ability of the global economy to just manufacture unending credit, the reality is that we are now doing just that — as the federal government borrows more and more in this emergency attempt to avoid widespread bankruptcies, impoverishment, continued health scares, and potential civil unrest.

Conversely, the exigencies of the health crisis and associated social distancing have served to further reward and enrich the technology savvy and already well-heeled — at the expense of an entrepreneurial, home-grown business tradition. Companies like Walmart, Amazon, Microsoft, Google and major financial institutions are becoming ever more dominant.

Despite attempts at expanding the social safety net, there is just too much that falls through the cracks. Proprietors and gig workers are challenged to qualify for unemployment. Small businesses close temporarily, many never to re-open. State and local governments that generally cannot borrow for operating purposes are staring into a fiscal abyss, requiring curtailment of essential public services. Even the medical system is not immune as freeing up space for COVID treatment has come at the expense of reducing other health services needed to financially underpin a full service, sustainable health care system.

In the space of just a bit over two months, government has intruded into the personal, communal and corporate spheres of American life in ways that may prove irrevocable. Whether we like it or not, government led us into the quagmire and will be stuck with much of the responsibility to bring us back out.

What are the ways out? We need to address both the personal and the corporate. The way out on the personal (individual and household) level may be most viable with adoption and funding of Universal Basic Income (UBI). I will attempt to address the corporate side of the equation in a subsequent blog post.

WHAT IS UBI?

The term “universal basic income” (or UBI) encompasses features of a wide range of past and present proposals — involving terminology and concepts such as citizen's income, basic income, living stipend, guaranteed annual income, and negative income tax. At its core, UBI can be viewed as a governmental program providing for a periodic payment delivered to all residents or families, ideally on a nation-wide or multi-state basis.

While the specific mechanics of UBI together with related proposals and programs vary widely, what is suggested here is a program concept intended to appeal across a cross-section of cultural, economic and political interests:

  • Unlike most welfare or social service programs, UBI payments could be delivered without any means testing, employment or other substantial bureaucratic qualifying requirement.

  • The amount of the UBI payment should be high enough to cover basic household needs and low enough so that there is continued financial incentive for gainful employment and entrepreneurial initiative.

  • Long-term implementation should be self-funding, with UBI costs covered by taxation on income that exceeds the UBI base amount, at a moderately progressive scale for persons and families of greater means.

  • Ideally, UBI would be integrated with and replace all other individual and household assistance programs — such as welfare, unemployment, Social Security, Medicare/Medicaid. Realistically, implementation is more likely to be phased in over time.

This graphic illustrates how a simplified UBI program might work. The blue line depicts the base threshold UBI payment amount (which might vary based on readily measurable factors such as size of household). With this illustration, recipients do not…

This graphic illustrates how a simplified UBI program might work. The blue line depicts the base threshold UBI payment amount (which might vary based on readily measurable factors such as size of household). With this illustration, recipients do not pay any federal income tax on the UBI amount (i.e., the 100% figure).

Two tax options are indicated for incomes above the blue line — a flat rate (orange line) as a fixed % of income above the UBI, and a graduated tax (green line) with higher tax rates at higher income levels. The more graduated (or progressive) the tax system is, the further will be the distance between the green and orange lines.

With this hypothetical example, the graduated rate would result in more after tax income for households at up to about 440% of the UBI amount. Households with more than 440% of UBI would pay a higher rate than with the flat tax, somewhat reducing their after tax income amount. UBI threshold payments and tax rates represent important adjustment tools within the mechanics kit, controversy over which could easily derail any proposal.

UBI BENEFITS

While currently thought of more as addressing a liberal or progressive agenda, the UBI concept has found interest and some traction within more conservative circles as well. Most notably, in the 1960s, 70s and into the 80s, the noted conservative economist Milton Friedman championed a proposal for a negative income tax as a replacement for existing welfare programs.

To date, experience with UBI concepts has been limited to small, experimental programs domestically and globally. Benefits both theoretical and real are identified as including the following:

  • More inclusive with fewer unintended consequences or coverage gaps than with means tested unemployment and social welfare programs

  • More quickly and effectively addressing current and future unforeseen shocks to the U.S. or global economies

  • Better capacity for seamless support through extended periods of lay-off or limited return to prior jobs than is readily possible with existing time-limited programs such as unemployment insurance

  • Concurrent capacity to also ameliorate longer term structural joblessness due to increased workplace automation

  • Opportunity for greater administrative efficiency at less cost (especially if accompanied by phased consolidation with other social welfare programs and application of up-to-date information technology)

  • Supportive of rather than competitive to private sector economic growth

  • Also supportive of non-economic philanthropic and other non-remunerative pursuits in a world that requires a reduced proportion of essential (albeit marketable) human work

  • More predictable and less cyclical underlying consumer demand via more stable and sustainable employment, business opportunity and public sector revenue

  • UBI mechanics conducive to minimization of political favoritism

  • Reduced risk of homelessness

  • Less social stigma and personal stress resulting in improved physical and mental health outcomes

At its best, UBI is a program that can be embraced by those of widely varied persuasions — maybe even considered as a non-partisan centerpiece of the 2020 election process. At its worst, without adoption, America runs the risk of not just less economic prosperity but ever widening inequality, weakened private and public sector service delivery, human impoverishment, declining health care, civil unrest and intensified class rancor.

The question: Is this a situation where the need to do something now makes possible a solution where the perfect does not become the enemy of the good? Hopefully so, if America can avoid the trap of the Affordable Care Act (aka Obamacare) where health care became more accessible than before. The downside was that ACA was adopted without bi-partisan support — so that subsequent health care system fixes and incremental improvements have proved near-impossible.

We may yet have a chance if the bi-partisan answer and iron-clad implementation commitment can be: Act now, refine later. That depends on bi-partisan support up-front, generating the stick-to-it-iveness essential for subsequent fixes and improvements as we together learn and adapt over time.

MAY 9 STATE-BY-STATE JOB LOSS & MORTALITY REVIEW

Note: Early in the pandemic up through this post of May 11, 2020 E. D. Hovee posted weekly updates of current COVID mortality and job loss data. This post represent the most recent and last of five weekly updates.

This is an update to last week’s mortality data — now extended through the week of May 9/10. Updated mortality rates were posted with this blog May 11. U.S. Department of Labor (DOL) data is posted as of May 14 — but for the week ended May 9 — allowing for a more complete complete review.

We are now 8 weeks into the current economic crisis with this data review starting for the week ending March 21 with the initial surge of unemployment claims. This may be the last weekly posting of the unemployment/mortality comparison.

We have run out of space for the week-by-week graph comparisons. More substantively, blog posts will now turn to address opportunities and challenges associated with the business of re-opening America’s economy while mitigating mortality risk. As you have questions or suggestions, please email me at ehovee@edhovee.com.

New Jobless Claims Nationally

This is now the 8th straight week of continued massive counts of unemployment claims filed nationally — with another nearly 3.0 million claims (seasonally adjusted) filed the week ending May 9, 2020. Over these eight weeks, cumulative filings of initial unemployment claims as tallied by DOL now are approaching a cumulative total of 36.5 million.

U.S. Weekly undmployment 5-9-20.png

Starting at over 3 million claims the week ending March 21, new filings doubled to the 6-7 million range each of the following two weeks, then eased off somewhat to the 5+ million level the week ending April 11, then to 4.5 million the following week, then to 3.9 million, declining further to 3.2 million new claims, and then to just under 3.0 million for for the most recent week ending May 9.

The analysis with this week’s posting again includes a comparison with continued unemployment claims. This reflects adjustments during the 2nd week after initial filing when counts are pared to continued claims eligible for unemployment insurance payments, as well as for persons finding re-employment. As these adjustments lag behind by one week, the number of continued claims nationally (as of the week ending May 2) was 22.8 million.

STATE-BY-STATE JOBLESS REVIEW

As in prior weeks, this update includes a comparison of experience for the 50 states plus two territories and the District of Columbia (DC) for the weekly unemployment periods ending March 21, March 28, April 4, April 11, April 18, April 25, May 2 and now May 9. Data is shown as a % of base pre-recession employment levels. Note: State-level DOL data is only available on a basis that is not seasonally adjusted.

Ten states now have cumulative 8-week initial unemployment filings that exceed 30% of their pre-recession covered job base — again led this most recent week by Georgia but at the extraordinary rate of 42% — followed by Kentucky, Connecticut, Hawaii, Rhode Island, Washington, Michigan, Nevada, Louisiana, and Pennsylvania. Nationally, claims average out to a 23% share of pre-recession employment.

State-by-State Jobless Claims 5-9-20.png

Eight of the top 10 jobless states remain in the same relative position as was the case during the preceding week - with two exceptions. In one week, Connecticut leaped up from the group of states in the bottom one-third of jobless rates to the #3 highest rate. Unemployment claims went from a cumulative total of 18% joblessness to 36% based on filings of this most recent week. Reasons for this situation are not entirely clear. Also noted is that Washington state went from the 9th to 6th highest jobless claims rate based on a substantial number of new claims for this most recent week ending May 9.

The 10 states (plus DC) with the lowest unemployment rates are the same as noted for the prior week, though there have been some minor changes in rankings. Texas his improved its already low jobless claims ranking as has the District of Columbia (DC).

While the pace of unemployment filings slowed once again in the week ending May 9 for most states, there were seven states for which filings increased as compared to the prior week ending May 2. Those with more filings are Georgia, Connecticut, Washington, Florida, New York, Wisconsin, and South Dakota. This is a grouping for which there appears to be no clear consistency of geographic pattern.

CONTINUED UNEMPLOYMENT CLAIMS

With seven weeks of data now in hand, it is now more useful to review the experience of continued unemployment claims (for those determined to be covered by unemployment insurance and not yet re-employed). This appears to be a still somewhat volatile metric, depending in part on where various states stand in clearing their backlog of claims.

With continued claims lagging one week behind initial filings, the total number of insured unemployed for the nation totals 22.8 million (on a seasonally adjusted basis) for the week ending May 2 — up by just over 450,000 from the prior week. This equates to 15.7% of pre-recession covered employment.

State-by-state data is reported on a seasonally unadjusted basis. The pattern of states with the highest rates of continued unemployment for those insured is somewhat different than for states with the highest rates of initial filings. The #1 state for the week ending May 2 is Oregon with continued claims representing 26% of the pre-recession covered employment base.

The other nine places in the top 10 are Nevada, Washington, Michigan, Mississippi, Rhode Island, New York, Connecticut, Puerto Rico and Vermont. This reflects a combination of northeastern and western states together with outliers of Michigan, Mississippi and Puerto Rico.

The top 10 listing experienced one major change from May 2 to the week ending May 9. California went from #1 position with the highest continued claims rate to #18 as its continued claims dropped from 4.8 million to 2.9 million in one week.

Of this top 10 grouping, five are also in the top 10 with respect to initial filings. The outliers that rank higher with respect to jobless insured versus all claims are Oregon, Mississippi, New York, Puerto Rico and Vermont.

By comparison, seven of the 10 states with the lowest initial filings are also the states with the lowest rates of continued claims as a proportion of total covered employment. Three states — Idaho, Kansas and Montana rank higher in terms of initial unemployment filings than with continued claimant rates.

STATE-BY STATE MORTALITY REVIEW

Through the weekend of May 9/10, an estimated 79,320 COVID-19 deaths represent a less than a 3% add-on to the 2.8-2.9 million deaths (from all sources) typically occurring across the U.S. With 11,575 new deaths, the latest week’s mortality is the lowest it has been since the week ending April 4. Barring a resurgence, it appears the nation has come across and is now dropping down the backside of the COVID mortality curve.

This blog post has focused on providing an update of cumulative deaths per million residents for each state. As with prior weeks, mortality data is from the New York Times (NYT) daily log (which was apparently bumped up the prior week ending May 2 to include some New York deaths for which COVID-19 is now viewed as the the presumed but not definitive cause of death).

Our composite data set starts with COVID deaths up to March 29, then proceeds with added deaths for each of the six following weeks to achieve cumulative totals as of the week ending May 9/10. (Note: Detailed counts with the New York Times listing can vary over the course of a 24-hour period as counts are regularly updated and the numbers used by this blog reflect the time of day at which the data is pulled).

As illustrated by the following graph, the U.S. COVID mortality rate as of this most recent week is now at just under 240 deaths per million U.S. residents. There are 10 states plus the District of Columbia that are above the national average rate — led by New York at a figure approaching 1,380 deaths per million. There were only 2,215 COVID deaths recorded for New York state during this most recent week, less than half the average experienced across the five earlier weeks (since the week ending March 29).

Covid Deaths as of May 9.png

There continues to be substantial variation between the state with the highest mortality rate (New York at 1,380 deaths per million population) — more than 125 times the state with the lowest mortality to date (for Alaska at less than 11 deaths per million residents).

There are 10 states plus the District of Columbia (DC) with COVID mortality rates that exceed the national average. This is a group that remains unchanged over the last week — albeit with DC now moving ahead of Michigan in terms of death rate per million residents. Of the 11 states, eight are situated in the mid-Atlantic to New England regions of the U.S. The anomalies are Louisiana, Michigan and Illinois.

Of these 11 geographies, there were only three for which this most recent week was their highest mortality week to date — Rhode Island, Pennsylvania, and Illinois. The other eight states have dropped down below prior mortality rates — some substantially so.

STATES WITH BELOW AVERAGE MORTALITY

As suggested by this wide spread in mortality, a better view of the experience for states with mortality below the national average is presented by the following more detailed graph covering 40 states and Puerto Rico. All are below the national average cumulative mortality toll of just under 240 deaths per million residents nationwide as of May 9/10.

Below Average Covid Deaths as of May 9.png

There are eight states with death rates in the range of 100-240 per million, another 17 with rates of 50-100, and 15 plus Puerto Rico still in the lowest range of less than 50 COVID deaths per million in-state residents.

The week ending May 9 represented a peak weekly mortality rate for 14 states — down from 19 the previous week. Of these 14 states, 11 have below average mortality as compared with the entire nation.

States in the 100-240 deaths per million range (below the U.S. average) but experiencing this last week as their peak mortality period to date are Mississippi and Minnesota. In the 50-100 mortality range are New Hampshire, Iowa, Missouri, Alabama, Florida and Arizona at what are peaking rates.

Of the 15 states plus Puerto Rico that have mortality rates of under 50 deaths per million residents, four experienced peak mortality for this most recent week — North Dakota, South Dakota, Texas and Utah. Despite low overall mortality, these states evidence hot spot activity important to monitor.

This leaves 28 states plus Puerto Rico as double winners (up from 15 the prior week ) experiencing overall average low mortality and no new peaking this last week. At present, these appear to offer the clearest cases to date for start or continuation of business re-opening.

SUMMARY NOTES

As described in more detail for the blog posting with the prior week ending May 2, it continues to appear that COVID-related mortality rates have leveled off and are now starting a downward trajectory. At the same time, unemployment claims — while still high from a historical perspective — are continuing to decline on a week-to-week basis.

Considerable variations are evident across the states — in terms of joblessness and even more so with COVID-19 related deaths. While there will undoubtedly be state- and local-level successes and failures along the way, each state and region of the country now is in position to tailor jurisdiction-specific approaches reflecting greater understanding of local needs and opportunities.

Re-opening can be expected to continue as an iterative process — speeding up or slowing the pace based on real-time experience monitoring with clearly articulated employment and mortality metrics.

MORE DEATHS FROM UNEMPLOYMENT THAN COVID?

While a complete review of the forecast provided in this May 9, 2020 blog is not yet possible, subsequent data compiled as of mid-February 2023 indicates that a significant proportion of the excess deaths (excluding COVID-19) that have occurred since February 2020 are potentially associated with job loss and increased unemployment. For added information, see the final supplemental portion of this blog post. I now proceed with the blog post of May 9, 2020.

Floating around the internet has been a rumor that each increase of 1% in the U.S. unemployment rate leads to an added 40,000 deaths — resulting from either poor physical or mental health affecting those unemployed, in some cases even after they become re-employed or retire. Renewed interest in this question was recently stimulated by a New York Post article of April 20, 2020 by John Crudele, titled: “Is unemployment really as deadly as coronavirus?”

Crudele cites as his initial source a character named Ben Rickert in the 2015 movie The Big Short about the Great Recession. Played by Brad Pitt, it’s Rickert who challenges his fellow Wall Street workers with the pronouncement: “Every 1 percent unemployment goes up, 40,000 people die. Did you know that?”

And by logical extension, the Post writer notes that increasing the unemployment rate by, say 10%, could lead to “400,000 deaths that have nothing to do with the virus and everything to do with the distressed economy.”

Apparently deciding that a quote from a movie may not be adequate substantiation, writer Crudele tracked down what may be an original source, a 1981 book titled Corporate Flight: The Causes and Consequences of Economic Dislocation written by academics Barry Bluestone, Bennett Harrison and Lawrence Baker, then again cited by Robert Carson, Wade Thomas, and Wade Hecht in their 2005 co-written book titled Economic Issues Today: Alternative Approaches, 8th Edition.

The actual paragraph of interest from the 2005 book is this: “According to one study [the one by Bluestone et al.], a 1 percent increase in the unemployment rate will be associated with 37,000 deaths (including 20,000 heart attacks), 920 suicides, 650 homicides, 4,000 state mental hospital admissions and 3,300 state prison admissions.”

While the specific impetus of the 1981 research was about a different cause of unemployment — then the concern was corporate flight from America, today it’s pandemic — this early study asks a question that has never been more pressing than today. That question is: Does unemployment affect mortality?

The New York Post writer’s story should not be viewed as an endorsement of this prior research. The author cites two differences between then and now. One is that, in the current situation, the federal government has “acted quickly to help the unemployed” which did not happen in earlier years when companies were moving overseas. Another factor cited is that much of the current job loss is for furloughed workers who may “get their jobs back once companies reopen their doors.”

The concluding remark of the Post article is: “Let’s hope that the data from 1981 is — excuse the expression — dead wrong.” But, really?

Should we discount the relevance of this historical precedent. The potential size of the impact cited by Bluestone, et al is particularly troublesome. Could just a 1% point increase really be associated with 37,000+/- U.S. deaths? So again, this got me asking: Could this earlier research really be valid — potentially applicable even today?

And that’s what led to the bit of statistical research I have conducted which essentially concludes: Yes, there appears to be a definite association of mortality with unemployment.

And the impact likely is now greater than estimated by Bluestone, Harrison, and Baker nearly 40 years ago. With this updated analysis, a more current estimate appears to be more in the range of 47,500 deaths for every 1% point increase in America’s average annual unemployment rate.

The rest of this blog article describes how this tentative conclusion is reached.

THE SCIENCE OF UNEMPLOYMENT-MORTALITY RESEARCH

Before launching into my own statistical examination, I decided to first check out whether and in what ways other similar research has been conducted more recently. While not widely known or publicized, there actually is a compendium of academic research assessing the relationship of unemployment to various indicators and causes of mortality.

A public health and epidemiology researcher, named M. Harvey Brenner, PhD, has conducted numerous studies focused on the relationship between economic well-being and community health. Dr. Brenner has held positions in public health and epidemiology at institutions including the University of North Texas Health Science Center, Hanover Medical University, Johns Hopkins University and Yale University.

In a BBC podcast/interview dated March 4, 2016, Dr. Brenner is quoted as stating that the figure of 40,000 U.S. deaths for every 1% rise in unemployment is still a “good rule of thumb.” This statement is based on his work dating back to the 1970s. In a 1979 hearing before the Joint Economic Committee of the U.S. Congress, Dr. Brenner noted that a 1% increase in unemployment is related to a 2% increase in total U.S. mortality. Added mortality follows behind increased unemployment over a 2-5 year time lag. And with more recent work, Dr. Brenner has pressed forward with continued detailed analyses— encompassing research on both sides of the Atlantic.

For example, a May 2016 study by Dr. Brenner titled The Impact of Unemployment on Heart Disease and Stroke Mortality in European Union Countries was prepared under the auspices of the European Commission. While focused on two indicators of unemployment-related mortality, the research begins by summarizing a range of European and U.S. epidemiological studies that “have shown since the 1970s that socioeconomic status (SES) is a stable risk factor for illness and mortality in individual persons.” A key observation from this literature review is that: “Unemployment is an important risk factor for mortality and morbidity — especially if the unemployment is of long duration.”

An underlying factor behind employment-related mortality is the stress resulting from unemployment. This stress manifests itself psychologically in outcomes that have been cited to range from depression to human violence including indicators as for suicide and homicide. Economic stressors include loss of income, poverty and economic inequality. Medical implications range from changes in diet and exercise to mortality as with heart disease and stroke.

Specific findings of Dr. Brenner’s empirical research from the European experience of 2000 - 2010/11 (including the period of the Great Recession) include the following:

  • The incidence of both heart attacks and strokes in the EU is strongly correlated with increases in unemployment.

  • There appears to be some delay between the time of becoming jobless to when an individual is at greatest risk of death — about a two-year lag for heart-related mortality and a somewhat longer delay averaging about three years for strokes.

  • Southern European countries appear to experience less incidence of unemployment related mortality than northern Europe — for reasons not entirely clear but potentially linked to healthier Mediterranean diets, warmer winters and more closely knit family ties, offering greater “social cohesion” for southern countries.

  • Older workers experience higher rates of unemployment related mortality — including “spread effects” that influence health beyond a person’s normal working life and extending across to other members of affected families.

This background review provided a starting point for thinking about how to frame an updated initial statistical analysis, assessing the historical relationship between unemployment and mortality in the U.S. — a discussion which now follows.

A MORTALITY-UNEMPLOYMENT HYPOTHESIS

For this initial research, I have applied a simple linear regression model to assess the statistical relationship between unemployment and mortality rates in the U.S. — over a time period extending from 1929 (just at the onset of the Great Depression) to 2017, the years for which data was most readily available from recognized sources. Four data variables are assessed with this statistical testing process:

  • Age adjusted mortality rates (as a % of the population), available for the years 1900-2017 as reported by the National Center for Health Statistics of the U.S. Centers for Disease Control and Prevention (CDC). Note: CDC/NCHS data adjusts death rates after 1998 to the age composition of the U.S. population as of 2000. Death rates prior to this time are taken from historical data.

  • Annual average civilian unemployment rates as reported by the U.S. Bureau of Labor Statistics and reported by the Economic Report of the President (2020), covering the years from 1929-2019.

  • Years with significant (above normal) mortality due to non-employment factors but that address considerations such as wars or pandemics are also included as a third binary variable in the analysis (as will be further described below).

  • Time trend is of particular importance for mortality as rates have experienced a strong downward trend over the last century with the advent and continued positive health results of modern medicine.

The form of the mathematical relationship being tested is:

Mortality Rate = f (Unemployment Rate, War/Pandemic, Time)

But before we get to the statistical testing, let’s take a look at the underlying data.

U.S. UNEMPLOYMENT & MORTALITY EXPERIENCE

We start the presentation of U.S. unemployment and mortality experience since 1929 with the first in a series of graphs. The red line shows annual deaths in the U.S. as a percentage of total (age-adjusted) U.S. population. The blue bars depict annual average unemployment rates for the same years. Trend lines are also shown for mortality and unemployment (together with the statistical regression equations and statistical fits measured as R-squared).

A-Mortality & Urate Trend.png

At first glance, there appears to be little relationship between unemployment and mortality rates over the last 88 years. In large part, this is because the long-term trend is for rapidly declining mortality due to advances in medicine, public health and other related factors such as improved diets and reduced poverty in the U.S.

Mortality in the U.S. has gone from 2.081% of the U.S. population in 1929 to a low of 0.725% in 2014. As shown by the R-square factor, the linear trend extended through 2017 explains 95% of the variation in year-to-year mortality over this time period.

While there is also some long-term downward trend indicated for unemployment, the greater factor is the still intensely cyclical nature of unemployment in the U.S. — with boom followed by bust — albeit of less severity (so far) than experienced in the Great Depression starting in late 1929. Only 13% of the variation over time in unemployment is explained by the trend line.

While there is a clear and strong overall mortality trend, substantial variations nonetheless appear at the micro level. This is most apparent when the mortality variable is focused on year-to-year changes in death rates — as illustrated by the next chart. The unemployment data remains the same as shown in the prior chart.

B-Change in Mortality vs Urate.png

This graph reveals considerable swings with year to year changes in the mortality rate — which are otherwise obscured by the overall long-term and strong downward secular trend. Note that despite the now more readily apparent fluctuations, most years are associated with a lower death rate than the year before. The biggest upward spikes in mortality occurred during the years of the Great Depression.

Much as when evaluating prices and trading on the stock market, these period-to-period gyrations often obscure more fundamental changes. A way of addressing this issue is to calculate moving averages — applied to both the unemployment and mortality data. In this case, a three-year moving average has been applied. For example, the moving average shown with the year 1932 would be the average of the years 1931-33.

The next graph depicts essentially the same information as with the prior graph, but with application of three-year moving averages to smooth over some of the volatility associated with annual data.

C-3 Yr Moving Averages.png

We are now at a point where it is possible to begin seeing more of the relationship between unemployment rates and annualized changes in U.S. mortality. However, if it is the case that mortality is influenced by unemployment, this effect is not necessarily felt immediately.

This is illustrated by studies such as those of Dr. Brenner which indicate that there is about a 2-year lag between unemployment and the most pronounced changes in heart-related mortality. With strokes and based on European experience, there is a somewhat longer average 3-year delay between the event of unemployment and resulting mortality increase.

In this case, we are concerned with overall mortality associated with a range of morbidity factors. Some will take longer to materialize than others — depending both on the eventual cause of death and the circumstances specific to each individual situation. In this case, after experimenting with several time delay factors, the analysis appears to best support an average 2-year lag from time of unemployment to resulting increased incidence of mortality.

This shift is shown by the following graph. The red mortality line is the same as with the prior graph — as we are measuring mortality as of the year that death occurred. However, the unemployment data is now shifted two years ahead of what was shown on the prior graph. In effect, the unemployment occurs ahead of any subsequent mortality.

D-2 Yr Lag with 3 Yr Moving Averages.png

In this graph, we now begin to see a much closer alignment between the timing of significant changes in unemployment and resulting changes (averaging about 2 years later) in mortality.

So far, we have explored two key factors affecting mortality, first, the long-term trend of reduced death rates over time due to improved medicine and better standards of living. And second, we have addressed the potential shorter-term effects that changing unemployment rates may have on mortality.

So, it is useful to now ask the question: Are there any other factors largely independent of the time trend and unemployment rate that may also potentially have a measurable effect on mortality?

With the European study, Dr. Brenner realized that there was a difference in the mortality profile between northern and southern Europe. Measuring the extent and the validity of this effect involved placement of a “dummy” or binary variable in the equation - a “1” for living in one part of Europe and a “0” for living in the other part of Europe.

With the current analysis, there are two factors that clearly appear to have effects on mortality other than time and unemployment — war and pandemic. In evaluating these two additional factors, it is clear that over the period of 1929 to present, there have been perhaps eight such events worth assessing for their relative significance:

Major War & Pandemics (with 100,000+ fatalities per year of the event):

  • World War II (with significant mortality from 1942-45)

  • Asian Flu (with most U.S. deaths in 1958)

  • Hong Kong Flu (with most U.S. deaths in 1969)

Minor Wars & Conflicts (with far less than 100,000 fatalities per year but yet significant both for combat death and post-war trauma):

  • Korean War (from 1950-53)

  • Vietnam War (with the most active combat from about 1964-73)

  • Gulf War (short lived and with relatively few fatalities in 1990-91)

  • The 9/11 Terror Attack (in 2001 but with potential spread effect)

  • Iraq/Middle East Conflicts (spread over a long time period, most active from about 2003-11)

The following chart is a replay of the prior graph but with these events and their timing also shown.

E - War & Pandemic Overlay.png

As this composite graph shows, there are varied spikes and troughs with the war and pandemic events considered. However, the overall effect on mortality is also being influenced by changing unemployment which has been mixed over the duration of these pandemic events.

This brings us to the regression analysis which is intended to better sort out the relative effects of each variable considered together with its statistical significance.

STATISTICAL REGRESSION ANALYSIS

After considering multiple options, the rough form of the selected regression equation is calculated as:

Mortality = (0.01448 x U-Rate) + (0.00089 x War-Pandemic) - (0.000126 x Time) + 0.01608

where:
Mortality = U.S. age adjusted death rate (as % of total population - calculated as a 3-year moving average)
U-Rate = annual average unemployment rate (expressed as % or decimal - also calculated as a 3-year moving average)
War-Pandemic = dummy or binary figure of “1” for major war/pandemic, “0.5” for minor war/conflict, or “0” otherwise
Time = Year from start of observations, extending from 1932 (Year 1 of observations) to 2016 (85th observation)

Note: Due to the use of a dependent mortality variable significant to five decimal places, coefficients to at least 8-9 decimal places are required as per the ANOVA tables provided at the end of this blog post.

For purposes of this analysis, the unemployment rate (U-Rate) is the primary independent variable of interest. If the unemployment rate increases by 1% (or by .01 in decimal terms), the death rate goes up by a 0.0001448 proportion (or by 0.01448%) of the total U.S. population. This may not seem like much, but when multiplied by 328.2 million U.S. residents (in 2019 as estimated by the U.S. Census Bureau), this equals about 47,500 added deaths for each year of this 1% unemployment increase.

For a few added statistics (as detailed at the end of this blog), the R Square factor for this regression is 0.9828 with the adjusted R Square at 0.9822, meaning that 98% of the variation in annual U.S. mortality rates is explained by the regression equation.

All variables are significant at a 95% confidence level. Based on t-statistics and P-values, the most significant independent coefficient is time — reflecting the strong downward mortality trend over 84 years. The unemployment (U-Rate) variable is also strongly significant at a 11.25 t-value. The War-Pandemic variable is also significant, but less so at a t-value of 4.23.

The relationship between mortality as predicted with this linear regression versus actual mortality experience is depicted by the following graph.

F-Actual vs Predicted Mortality Rates.png

The predicted values generally do well to catch the upsurge in mortality with the Great Depression through World War II and provides its best fit in the period from about 1950-74. From about 1974-93, actual deaths run consistently somewhat below projection with the biggest mismatch in the early to mid-80’s — a time of two recessions but with a relatively large and healthy baby boomer population in prime working years.

The forecast is then relatively on-track with exceptions of somewhat underestimating mortality in the wake of the recession of 2000 and the 9-11 event of 2001. And mortality in the most recent years of 2013-16 has not declined as much as would have been expected with recovery from the Great Recession — which may be in-part due to some flattening out of the long-term mortality trend.

CONCLUDING OBSERVATIONS

While preliminary, the results of this initial analysis are several-fold and sobering:

  • There is a statistically significant relationship between unemployment and mortality in the U.S.

  • There appears to be a time lag of about two years, on average, between the event of unemployment and subsequent associated mortality.

  • Results of this analysis are consistent with other economic and epidemiological studies that have also quantified both a significant and time-lagged relationship between unemployment and subsequent changes in mortality.

  • The one-year increase of 47,500 deaths for a 1% point increase in unemployment associated with this analysis would represent 1.67% of the 2.84 million deaths (from all causes) across the U.S. as of 2018. This is below the 2% mortality increase previously estimated by Dr. Brenner but is consistent with a decline in overall mortality due to improved U.S. health and medical care since the time of his earlier analysis.

  • This 47,500 estimate also corresponds reasonably well with the Bluestone, et al estimate of up to about four decades ago. With 40-45% U.S. population growth over 35-40 years, the Bluestone 37,000 estimate made then would translate to about 51,500-54,000 today based on population growth alone — but then adjusted down for overall declining mortality in the intervening years.

  • The mortality numbers can get much higher, as the annual unemployment rate and/or the duration over which unemployment lasts increases. If annual average unemployment increases by 10% points over a full year through about April of 2021, the nation is at risk of as many as 475,000 unemployment-related deaths. If the unemployment impact were to move into the 20%+ range over a 1-year time frame, the death toll conceivably escalates to nearly the million-person range. The same result ensues if there is an average 10% increase that lasts over two years.

  • The time lag means that the most substantial after-effects on mortality resulting from current rapid increases in unemployment are likely to be experienced about 2-3 years from onset of the pandemic and large scale job layoffs — potentially even after the initial mortality effects of the COVID-19 virus have clearly subsided.

  • The public health perspective nationally and at state/local levels should be adjusted to address not just pandemic deaths but also mortality that reasonably might be expected with increased unemployment — both short- and longer-term. This clearly suggests getting Americans back to work and to stabilized incomes sooner rather than later. And it also depends on a much more balanced approach in planning for and executing responses to future pandemic or other emergency situations of national or global proportion in the years ahead.

SUPPLEMENTAL NOTES: ANOVA DETAIL

Summary output or analysis of variance (ANOVA) detail for the selected regression equation as calculated with Microsoft Excel is provided by the following table.

F-Actual vs Predicted Mortality Rates.png

Several added technical notes are made regarding the analysis conducted to date:

  • In assessing an appropriate time lag for mortality, separate regressions were run for the mortality-unemployment-war/pandemic datasets with time lags of 1, 2, 3, and 4 year periods. The 2-year lag performed best in terms of R squared, t-value and F-statistic outputs. The 3-year lag was next best, then the 1-year and 4-year regression runs.

  • With the binary/dummy variable, consideration was given to a single variable (with 0.0, 0.5 and 1.0 values for no issue, minor war/conflict and major war/pandemic, respectively) versus a two-variable approach. The two-variable approach involved separate dummy variables — one for major war/conflict periods and a second for minor war/conflict years. The two-variable approach yielded a slightly lower R-square coefficient and also lower t-values than experienced with a single binary variable. Of considerable importance was the observation that the coefficient for the minor war/conflict variable was 49% of that for the major war/pandemic variable, which supported the 1.00/0.50 application with the single binary variable as the preferred model.

  • This analysis was limited to a 1929 and later time period as the most readily available unemployment information starts at 1929, while NCHS age-adjusted mortality data is available back to 1900. Currently out-of-print information from the National Bureau of Economic Research (NBER) is available from 1900-54, but with some data mismatches in the overlapping time periods.

  • As noted, the mortality data is age-normalized rather than reflecting the actual year-to-year mortality for populations for the dataset sampled. Future refinements might also include non-revised rather than NCHS age-normalized mortality for purpose of comparison and explanatory utility.

  • As discussed by analyses such as Brenner’s work for the European Union, there are other potentially inclusive indicators of economic health than sole reliance on unemployment statistics. More encompassing indicators might include gross domestic product (GDP), various measures of income inequality, and measures of socio-economic status (SES).
    There are two problems with this approach. First, is that there can be substantial disagreement on what these more encompassing indicators should comprise. Second and perhaps of more importance for this analysis, while these SES-type indicators might be more all-encompassing, they tend to lag behind unemployment. Despite its limitations, unemployment data represent, in effect, the proverbial “canary in the coal mine” — providing the most advanced warning of what may be to come.

Additional information in response to inquiries is available on request. This blog is subject to minor edits subsequent to initial posting on May 9, 2020. For regularly updated information regarding U.S. COVID case-mortality, employment and economic recovery to date from the pandemic, click here on Economy Watch.

Update Notes (As of February 23, 2023)

Since formulating the forecast model early on in the pandemic, it has been this author’s objective to review actual outcomes with comparisons as may be possible to the forecast model. This has proved challenging for three primary reasons:

  • COVID has unfolded, then receded and re-emerged in several waves to date — with mid-pandemic assessments challenged, especially as mortality associated with unemployment increases occurs well after the fact (estimated at about 2 years). This necessitates a considerable wait (till about now) to begin conducting a retrospective review.

  • The forecast model applied (as described above) also uses a 3-year moving average to smooth the data, removing excess data “noise” that could render interpretation of the results more challenging. The combination of a 2-year lag between unemployment and mortality coupled with a three year moving average means that some of the data for out-years of the pandemic (as for 2022) is not yet available. NCHS-CDC compiled mortality data is currently available only through the 2nd quarter of 2022. The 3-year moving average for mortality means that results for the near tail end of the pandemic (assuming it is 2022) requires mortality data extending through 2023 which is now just underway.

  • Finally, the rapid intervention of the Federal Reserve and congressionally approved stimulus meant that, while unemployment briefly spiked to nearly 15%, jobless rates were then subsequently rapidly reduced — more so than occurred with other major economic disruptions which did not include such massive stimulus. In effect, there may be economic hardship (including business closures, start/stop cycles with various lockdown measures, and related economic stresses) beyond what is fully captured by unemployment rates alone.

With these admittedly significant caveats in mind, it is nonetheless useful to review what can be discerned from COVID and unemployment experience to date. As of mid-February 2023, NCHS-CDC data indicates that there have been an estimated 1.3 million excess deaths in the U.S. since February 2020. Of this number, 320,000 (25%) of the deaths over this approximately 3-year time frame are labelled as “excess deaths — all causes excluding COVID-19”.

Using data that is available and interpolating for information not yet available, the forecast model as formulated and applied indicates that between about 225,000-300,000 deaths across the U.S. may be associated with both direct and indirect consequences of unemployment and related stresses to date. The range is based on how data points not yet available are interpolated based on information that is available to date.

Even with uncertainties of methodology and data for both CDC estimates and modeling with this analysis, initial evidence suggests that a majority (perhaps 70 to 90+ percent) of the non-COVID excess deaths since start of the pandemic may be associated with unemployment and related economic stresses through the pandemic.

An objective of this author is to update this forecast model and retrospective analysis once a more complete dataset is available — most likely at some point in the 2024-25 time period. Going forward, any value with this initial modeling exercise as occasioned by The Big Short may be subject to review and refinement in the years ahead. A more sophisticated, science-based and appropriately nuance approach ideally should enable practitioners and policy makers to better understand the linkages between major health crises and economic dislocation — for improved policy choices should events of this type and magnitude recur in the future.

Initially Copyrighted © May 9, 2020 by E. D. Hovee & Company, LLC
To receive my periodic blog posts, simply e-mail me at ehovee@edhovee.com and say “Subscribe”