Note: this blog has been updated (most recently as of December 19, 2022) for more recent data since first posted on October 26, 2022.
The U.S. economy is in the midst of an unexpected and extraordinary inflationary spiral — peaking at a 9% rate of year-over-year annual inflation as of June 2022. Since World War II, this is exceeded only by inflationary peaks of 12.2% in 1972 (with the OPEC oil embargo) and 14.6% in 1980 (with the dot-com bubble).
After a prolonged period of near-zero interest rates set by the Federal Reserve, the Fed has now aggressively taken on the task of rapidly increasing the Fed Funds rate, with monthly rate increases of 0.25% points starting in March, increased to 0.50% in May, then with subsequent increases of 0.75% points in each of the months June, July, September and November — with a somewhat reduced 0.50% increase in December.
Prior projections indicated that the Fed anticipated its median target rate to be in the range of 4.6% by the end of 2023. With the December 2022 rate bump, the fed funds rate increased to 4.25-4.5% — with further increases now anticipated to reach a range of 5-5.5% in 2023.
The question is whether the Fed has been raising rates too fast — with risk of a hard landing and economic recession ahead in coming months. The opposing argument is that the Fed needs to move even more aggressively, before inflation rates of 9-10%+ per year get baked-in to the U.S. economy.
To help address this question, this blog post takes a look at the post-WWII experience of American inflation, the response of federal fund rates, and changes in economic performance (using the bellwether metric of unemployment rates). We look at two types of inflationary periods — those largely demand created and those reflecting supply shocks (including periods as at present reflecting a combination of demand and supply-side challenges).
Looking ahead, it is essential to recognize that the Fed has a limited set of monetary tools available. These tools are best suited to tackle the demand-side portion of the current inflation run-up — albeit dependent on reasonable domestic consensus for public fiscal as well as monetary restraint. Supply-side constraints are largely beyond the Fed’s direct purview but will depend on addressing supply bottlenecks one at a time, focused on resiliency and productivity of U.S. industry and labor force.
The Big Picture Look
As illustrated by the following (rather complex) graphic, 11 periods of inflationary bouts can be identified over a 68 year time frame from 1954 to present. Across the full timeline, corresponding metrics of annual CPI inflation, the effective Federal Funds rate and unemployment rate are depicted.

Source: FRED data of the St. Louis Federal Reserve for all graphics of this blog and associated analysis. The above graph encompasses monthly data points with CPI inflation and unemployment rates seasonally adjusted — together with the effective federal funds rate. Inflation cycles are illustrated by portions of the graph with blue background. Each period begins with an uptick in annual CPI (from the prior month) and ends following a subsequent month of peak unemployment.
The longest inflationary cycle noted covers a 10+ year the period extending from April 1959 to December 1970 — with modest inflation over about half of this time frame, accelerating thereafter. The shortest inflationary run-up followed by unemployment peaking occurs over a 26-month period from August 2007 to October 2009 through the Great Recession of 2007-09.
Demand-Driven Inflation
Of the 11 inflationary periods identified, six appear to have been driven primarily by excess demand in the U.S. economy — outstripping normalized productive supply capacity. Perhaps the poster child of this type of inflation and resulting Fed response is illustrated by the 2004-07 latter portion of the era known as the Great Moderation, including passing of the Fed baton from then Chair Alan Greenspan to Ben Bernanke.
As shown by the following chart, this was a time of sustained low unemployment (trending down from less than 6% to arrive closer to 4%) and of moderate annual CPI increases (ranging from less than 2% up to just nearly 5%, then dropping back down). This is also the one historical period over which the Fed methodically and systematically moved up its federal funds rates — starting at 1% in May 2004, increasing step-by-step (averaging about a 0.17% point increase per month) to just over 5% by June 2006.

Note: Areas shaded in gray at the left and right edges of the graph indicate rates in the month just before and then just after the period which is the focus of this time period.
This mechanistic approach to Fed intervention appeared to have worked remarkably well over the period in question. The Fed intervened to successfully choke off inflation that peaked in September 2005 without adversely affecting employment for American workers. In fact, the unemployment rate actually declined.
However, subsequent history has been less kind to Mr. Greenspan. Within a few months of this inflationary cycle, accommodative Fed policy (and subprime mortgage lending) would give way to the Great Recession of 2007-09. In short, monetary policy reliant on federal fund rates on its own proved inadequate to address the financial and economic tsunami just ahead. Structural and regulatory reform was also needed but despite advance warning did not arrive in time.
There are five other periods of demand-driven inflation that warrant briefly reviewing:
The affluent society period of bi-partisan goodwill during the 2nd term of the earlier Eisenhower Administration with continued post-war recovery including a baby boom that increased demand for consumer services, suburbanization and interstate freeway investment across the U.S. Inflationary pressures emerged in 1957 but were not adequately matched by monetary tightening, leading to recession in 1958 with accompanying near doubling of unemployment.
The guns and butter era of the Kennedy and Johnson administrations as one of the longest periods of economic growth but with fiscal tightening ultimately needed to fund Vietnam War deficits and with federal funds rates increasing to the 9% level accompanied by resulting recession and unemployment in 1969-70.
A period of elevated but stable unemployment with double-dip recession in the Ford-Carter era of 1976-80 with rising inflation matched by similarly aggressive increases in Fed funds rates to an all-time high rate level reaching nearly 18% — albeit with only minor changes in the already elevated U.S. unemployment rate over this period.
A nearly 6-year portion of the Reagan-Bush era extending from late 1986 to mid 1992 with transition of Fed Chair from Paul Volker to Alan Greenspan — during which Fed fund rates increased to about 10% to address rising inflation but with relatively stable unemployment maintained until the early 1990s as interest rates ultimately proved to be held too high for too long.
And finally, the portion of the Obama presidency from late 2010 to mid 2012 as the Fed maintained unprecedented accommodative monetary policy of nearly 0% interest with recovery from the Great Recession and slowly declining unemployment from about 10% to 8% and with inflation briefly doubling up to the 4% level then back to 2% (a reflection of continuing post-recession labor force slack in the economy).
Supply-Side Inflation
Less appreciated but important for this current inflationary bout is the potential significance of supply-side inflation. This can be driven by factors ranging from supply chain gaps (as with increased delays in shipments) to workforce availability not adequate to meet employer needs. In many but not all cases, supply-side inflation occurs unexpectedly from external shocks as with the war in Ukraine with resultant production curtailments on globally important supplies ranging from petroleum products to critical food supplies (as with grains).
Of 11 inflationary experiences documented since WWII, five appear to involve clear supply-driven shortages leading to increased pricing. Perhaps the classic case of supply-side inflation occurred with the OPEC oil embargo of 1973-74. The effects on CPI, Federal funds response and resulting economic performance (as measured by unemployment) are illustrated by the following graph.

The oil crisis took hold in October 1973 when OPEC members led by Saudi Arabia enacted an oil embargo on nations that had supported Israel during the Yom Kippur War. By the end of the embargo in March 1974 the price of oil had risen by nearly 300% globally, more in the U.S.
Inflationary pressures were already being felt on the U.S. economy and by late 1974 the U.S. CPI had increased by 12.2% over prior year levels. The Federal Reserve moved quickly and aggressively in an attempt to quell this unprecedented inflationary spiral, raising the Federal funds rate to a peak of 12.9% as of July 1974. Inflation eventually did come down, but with significant reductions not apparent until early 1975.
Unemployment rates went from about 6% to 9%, before finally starting to drop in May 1975, about 1-1/2 years after the embargo had been placed.
Fed action is clearly warranted with demand-driven inflation. However, in this instance, with inflation almost totally supply-driven, the Fed’s reliance on increasing interest rates seems clearly misplaced. Fed actions served to increase interest rates and unemployment — an unnecessary double blow to the American economy and with little direct effect on oil price inflation. With some recognition as to the limitations of a monetary response, the economic blow was further compounded by the imposition of wage and price controls by the Nixon Administration. The result was the worst of all worlds — stagflation persisting with subsequent and renewed economic crises into the early 1980s.
There are four other instances identified of inflation involving a significant supply-side component. However, these are somewhat more perplexing to unravel as demand factors also came into play — increasing the challenge of finding and executing an appropriate, effective policy response. These four other supply-side inflationary episodes are briefly outlined as follows:
The dot-com bubble and 9-11 attacks of 2000 reflect the combined effects of demand- and supply-driven inflation — with inflation going from about 1-1/2% in early 1998 to a peak annualized rate of 3.76% as of March 2000 — remaining at elevated levels into early 2001. Fed funds rates increased somewhat from less than 5% to 6.5% before quickly dropping as inflation subsided but with some relatively modest and on-going increase of about 2% points in nation-wide unemployment rates.
The period of the 2007-09 Great Recession was kicked-of by a doubling of the inflation rate from the range of 2% to 4% between August and November 2007 with inflation further peaking at 5.5% as of July 2008. Due to the collapse of credit (affecting homeowners, businesses and banks), the Fed lowered interest rates continuously throughout this period, going from a Fed funds rate of over 5% as of August 2008 down to 0.12% by October 2009. Unemployment increased from 4.6% to 10% over the same period. This clearly was a case where the federal funds rate was largely irrelevant to combat inflation; shrinking consumer demand coupled with financial instability is what made the transition to a lower inflation environment possible.
The experience of 2015 to mid 2019 yielded different outcomes with both demand and supply factors driving inflation. Fiscal stimulus factored in during the Obama administration followed by both supply-side deregulation and protectionist policies with Trump’s presidency (pre-pandemic). CPI inflation increased from less than 1% to nearly 3% by early 2017, dropped to 2% before returning to the 3% range by summer 2018 and back to 2% or less by early 2019. Throughout this period, fed interest rate policy was mildly restrictive with the federal funds rate going from near zero to about 2.4%. Unemployment declined from less than 6% to under 4% — clearly an example of the monetary policies of Janet Yellen and then Jerome Powell to generate low target rates of inflation while also facilitating robust employment growth.
Finally, the current time period of May 2020 to present reflects the sequential effects of the COVID pandemic followed by fiscal stimulus and pandemic recovery leading to resurgent inflation starting in early 2021, plateauing briefly in the 6% range as of Summer 2021 then going to peak levels of 9% year-over-year inflation by mid 2022 — with the demand driver of fiscal stimulus now further complicated by supply bottlenecks related to energy, supply chain management and workforce availability. Federal monetary policy remained extraordinarily accommodative at nearly zero federal funds rates until Spring 2022. Unemployment has continued to drop to an historically low 3-4% range. As illustrated by the following graph, this represents a case where the Fed maintained interest rates too low for too long — perhaps missing the more appropriate tightening window by as much as a year.
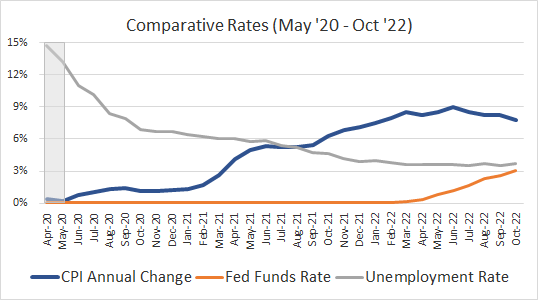
Note: This graph may be updated periodically to represent changing current conditions.
With this experience providing the background context, the question now on the table is: Might the Fed now make matters worse by going from too accommodative to too restrictive?
Metrics Anyone?
Looking back over nearly 70 years of experience, it is fairly clear that the management of interest rates (specifically fund rates) by the Federal Reserve has been fairly idiosyncratic — depending on the economic philosophy and predilections of Fed Chairs and Governors of each era in addressing widely varied economic conditions.
The Federal Reserve Act mandates that the Federal Reserve conduct monetary policy "so as to promote effectively the goals of maximum employment, stable prices, and moderate long-term interest rates." Even though the act lists three distinct goals of monetary policy, the Fed's mandate for monetary policy generally boils down to a dual mandate of maximum employment as one mandate and with stable prices plus moderate long-term interest rates as a second mandate.
However, in practice the first stated goal of maximum employment consistently takes a back seat to the job for which the Fed has the most experience — managing inflation and setting interest rates. In effect, acceptable employment (or unemployment) levels may fluctuate up or down as a residual resulting from Fed actions aimed primarily to address price stability and interest rates.
What can be determined is that there are substantial differences that accompany demand- versus supply-driven (or combined) conditions for inflation. On the one hand, the Fed has been prepared to more aggressively ratchet up interest rates in demand-driven periods of inflation. On the other hand, the Fed has also been willing to accept higher levels of unemployment to combat supply-driven (or supply plus demand-influenced) inflation.
Trough to peak rates of unemployment increase by nearly double in supply- and combined periods of inflation as occurs during demand-only inflationary run-ups. This may be occurring because the Fed has useful monetary tools to address the demand side of inflation but little in its tool-kit to address supply-driven inflation.
This peaking phenomenon is somewhat offset by the duration of the period over which increased unemployment is experienced. Demand-driven inflation tends to be resolved over a longer duration than is the case with supply-driven (or combined demand-supply) bouts of inflation. In large part, this is because supply issues which generally are externally generated tend to be resolved more quickly once the embargo or supply chain issue(s) at hand are addressed (whether privately or publicly). The exception is labor force availability — a supply constraint likely to persist over a longer term due to rapidly changing demographics of the American workforce.
So, How is Current Inflation to be Resolved?
At the outset, it is critical to understand that the current inflation reflects both demand- and supply-driven dynamics:
The demand-side of the current price run-up is due to a multiplicity of pandemic and post-pandemic factors largely centered on significant fiscal stimulus creating demand for goods and services that exceed realistic productive capacities — especially in the face of recovery from the COVID pandemic. These conditions are readily understood by the Fed and are addressable by monetary tightening, notably by increasing interest rates to reduce borrowing demand (albeit at the added potential expense of a hard landing with renewed unemployment).
The supply-side of inflation is not so readily addressable with existing Fed tools. Some issues ranging from supply-chain shortages and bottlenecks are likely to be ultimately self-resolving through actions of multiple private actors seeing opportunity for added profit at the margin. Other issues may be of longer duration as with reduced work force (due to retiring baby boomers) or commodity and energy supply constraints (catalyzed by the Ukraine conflict and by public policy resistance to increased domestic fuels investment and production).
Perhaps the best metric readily available to identify and quantify effects of supply-side inflation is provided by data regarding productivity of the U.S. workforce. Over the last decade, American productivity has increased by an average of 1.3% per year. However, in 2022 productivity has gone negative to a low of a negative 2.0% year-over-year (decline) as of the 2nd quarter of 2022 — an indicator of how supply bottlenecks and wage increases are putting upward pressure on inflation.
The greatest risk now facing the Fed is the temptation to go for broke to reduce both demand- and supply-side inflation — albeit primarily reliant on the monetary tools most readily available at its disposal. A more practical approach is to take on the demand-driven forces via higher interest rates while recognizing that supply-side issues need to be addressed primarily through other (non-Fed) means.
In the short-term, this may mean living with reduced but above recently experienced rates of inflation until supply-side issues can be addressed one-at-a-time. Public-private cooperative initiative is pivotal for this to happen sooner than later:
Recognizing that workforce shortages may remain front-and-center over this decade (and perhaps beyond), key productivity steps are to encourage automation of low-skill/low wage jobs allowing more workers to migrate up the career ladder — also to pursue skills-based in-migration policies.
Aligning public policy to encourage more U.S. fuels production for domestic and export use as a short-term expedient until carbon-free technologies prove capable of fully scaling up for replacement of fossil fuels — also allowing reasonable time frames for return on investment to avoid becoming encumbered by stranded, productivity-sapping energy assets.
Stabilizing mortgage rate increases to allow for valuation adjustments that will allow home buying to renormalize — also encouraging renewed construction to better meet pent-up demand — especially for family-forming millennials. As the full effects of rate increases to date likely will be somewhat delayed until the spring 2023 typical seasonal uptick in market demand, there is value in waiting to see how home sales and valuations are adjusting before further pursuing continued aggressive interest rate hikes. Letting the market adjust incrementally is preferable to effecting a market crash from which recovery will be more difficult.
Bottom-line, the risk of the current unexpected inflation is the slippery slope toward persistent stagflation — of weakened economic activity coupled with unending cost of living erosion. Getting through this period requires use but not abuse of monetary tools within the purview of the Federal Reserve — coupled with fiscal tools of state and federal governments and the private sector working in partnership for a more productive and inclusive America.
If there is an example to avoid, it would be the Fed’s overly aggressive and relatively ineffective attempt to beat down a OPEC-driven supply-side inflation with demand suppressive tools of the Federal Reserve as experienced during the Nixon Administration. Monetary tools proved ineffective to corral inflation and the nation paid an unnecessarily high economic price with unemployment increasing from 3% to 9%.
In today’s situation: Until CPI inflation shows clear signs of easing, the Fed is justified to continue moving interest rates further upward — systematically and cautiously. in short, slow the rate of fed funds rate increases to a pace allowing for easier and incremental market adjustments — avoiding a hard landing that could unnecessarily imperil U.S. economic prosperity and equitable outcomes for years to come.
