A headwind to the Fed’s fight against inflation is the recent decline in U.S. worker productivity. This blog post reviews long- and short-term productivity trends together with more detailed consideration of productivity by economic sector and by state.
Key observations resulting from this review are four-fold:
From 2012 through the 1st quarter of 2023, U.S. labor productivity has increased at an average pace of 1.2% per year. However, productivity has gone negative over the most recent five quarters from 2022 to present.
If productivity could revert positive to the long-term norm, inflation could be reduced by an offsetting amount in the range of 2.5 - 3.0 percentage points on an annualized basis.
Over the past decade, the greatest worker productivity gains have been experienced by the mining, management, information and professional/business service sectors of the U.S. economy. The most prominent losers are associated with the educational services and transportation/warehousing sectors.
When considered by state and region, the most rapid productivity gains over the last decade were experienced in the western and northeast regions of the U.S. With the pandemic experience of 2021-22, these regions reversed position, with the west and northeast regions experiencing the greatest losses in labor productivity.
Overall Labor Force Productivity Experience
Quarter-by-quarter workplace productivity experience for the U.S. is depicted by the following chart — extending from 2012 to 2023/Q1.

Source: U.S. Bureau of Labor Statistics (BLS). Data is compiled on a quarterly basis. Labor productivity is defined by BLS as the value of U.S. output value per labor hour.
As indicated by the graph (and counterintuitively), after years of relatively stable change, productivity peaked during the early pandemic years of 2020-2021, then went sharply negative in the post-pandemic recovery period starting the 1st quarter of 2022.
While long-term productivity has averaged gains of 1.2% per year, productivity dropped to an negative 1.5% annualized rate from the 1st quarter of 2022 through to the first quarter of 2023.
The productivity experience of 2020 to present appears skewed by the disparate effects of sectoral employment changes through the pandemic and beyond to economic recovery. Adverse effects of the early pandemic period and associated lock-downs were disproportionately experienced by lower wage hospitality, retail and personal service workers. Higher wage white collar workers who could work remotely are associated with higher productivity (as measured in terms of output value per labor hour).
Conversely, economic recovery came last to these same lower wage workers in customer-facing positions. As these sectors are associated with lower output value per labor hour, a somewhat perverse effect of re-normalizing has been to dampen worker productivity with post-pandemic recovery to-date.
A simplistic conclusion might be that the easiest path to increasing productivity is to get rid of lower wage jobs. However that is, at best, a short-term expedient — not sustainable either for the temporarily displaced workers or the long-term functioning of a full service economy.
There is one other factor at work through this disruptive period and continuing— of significance to productivity long-term. This is the exit of a large number of aging baby boomers from the workforce, being replaced by a smaller cohort of GenZ entries currently into the labor force.
The productivity loss of experienced workers has yet to be offset by downstream potential as GenZ and millennial workers transition to hit their full productivity stride. Getting there sooner rather than later will be pivotal to deflating structural inflation pressure and better assuring economic prosperity going forward.
Productivity by Economic Sector
This is not the full productivity story. Also important to briefly review is productivity by economic sector and by state/region of the U.S.
Over the decade from 2011-2021, output per hour associated with U.S. private sector employment has increased by 16%. However, as illustrated by the following graph, productivity changes have varied widely by economic sector.

Source: BLS. Output per labor hour is calculated based only on private sector employment.
The greatest private sector productivity gains noted are with mining — up by 80% in a decade. Other strong gains are indicated for information (notably software and information technology associated with high wages), retail trade (shift to big box stores and e-commerce), management of firms, administrative/waste management services, professional/business services and wholesale trade. Declining productivity is noted for transport/warehouse functions, (private) educational services and (surprisingly) for manufacturing.
Productivity by State & Region
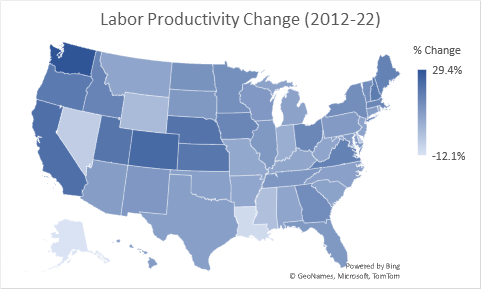
Finally, it is worth considering productivity experience of U.S. states and geographic regions — over both the last decade and also most recently as experienced from 2021-22 (a period of declining productivity nationally). The first map below depicts % changes in labor force productivity over the decade long period of 2012-22. Darker colors are noted for states with greater productivity increases.
Source: BLS.
#1 in productivity gain for the U.S. over the last decade is Washington state — led by technology-related firms with an overall 29% gain in output per labor hour. #2 is Colorado, followed by California, Nebraska and Utah.
Alaska is associated with the worst productivity experience with output per labor hour dropping by 12% over the last decade — followed by Louisiana, Nevada, Delaware, Mississippi and Wyoming. With the exception of these six states, all other states experienced some level of productivity gain.
When considered by region of the U.S., western states experienced a 19% productivity gain — most in the U.S. — followed by the northeast and then the midwest. Southern states experienced the lowest productivity gain — up by just over 8% for the decade.
The second map (shown below) depicts the very different and most recent productivity experience of 2021-22. Of the 50 states, 37 have experienced productivity declines with just 13 showing productivity gains.

Source: BLS.
The #1 gainer was Idaho — with productivity up by 4% in just the one year from 2021-22. #2 is Minnesota, followed by Nebraska, Connecticut and Kentucky.
The worst performers for this most recent one-year period were Alaska (down by 7% in one year), followed by Louisiana, Nevada, Hawaii, North Dakota and Mississippi. These appear to be states with strong dependence on tourism and/or agriculture. Four of these states were also among the lowest productivity performers over the last decade (as well as for the most recent year).
In terms of broader regions of the U.S., midwestern states were the least negatively affected from 2021-22 with the west region most adversely affected.
Bottom Line
Two concluding observations:
Restoring productivity from the experience of the last year is pivotal to Whip Inflation Now (or WIN) as known during the nation’s 1974-era bout with inflation.
Getting there sooner than later requires focus on a successful and fast-paced productivity transition from the baby boomer driven economy of the last 30-40 years to the increasingly millennial and GenX reliant cohorts of today’s labor force — including but not limited to commercialized artificial intelligence (AI) applications.
For comments on this blog post or to request inclusion on my email notification list for future E. D. Hovee blog posts, please email, addressed to: ehovee@edhovee.com
Also note: A listing of and links to past blog posts is available at:
Blog Post Listing.
